At What Point are We Today ?

27-Sep-2023. Where are we in the cycle? Since several months have passed since my last post on this topic, it's time for an update. Part 1. Let’s assume the full cycle lasts from the first Fed’s hike to the last cut. The last 10 cycles are presented in the first chart. The longest cycle lasted over 9 years (1994-2003), the shortest 3 years (1959-61). The vertical axis marks the beginning of each of the 10 cycles, i.e. the day of the first rate hike by the Fed. Then, on the horizontal axis we have the number of calendar days that have passed until the next event. And the usual order of events in a cycle is (Y-axis, top to bottom): (1) beginning of tightening, (2) curve inversion, (3) a peak on the S&P500, (4) a low in unemployment benefits/U3 rate, (5) end of Fed tightening, (6) end of curve inversion, (7) beginning of recession, (8) beginning of the Fed's easing, (9) low on the S&P500, (10) end of recession, (11) end of easing. In the second chart, I have plotted today's situation on the time ranges of those events from the previous 10 cycles. We started the tightening cycle on March 17, 2022. Clearly, the current cycle is different from the previous ten. For example, the stock market (S&P500) marked a peak (January 3, 2022) before the first interest rate hike - which did not happen in the previous 10 cycles, and a trough on S&P500 occurred (October 12, 2022) before the end of the tightening cycle (this also never happened in the previous 10 cycles). In my opinion, the peak and trough on the S&P500 from 2022 should be "excluded" from the analysis of the current cycle (and treated as a separate mini sub-cycle, which was formed as a result of the market "panic" due to high inflation rate - and yet today we already know that the economy has not slowed down at all (at least until today) due to this spike in inflation). In this approach, from the point of view of the history of cycles, it can be said that we are currently in the phase of forming a peak on the S&P500 (and it does not matter whether we will actually see or not a new all-time high in this cycle). It can be assumed that the current phase is the period immediately after the end of the hikes, the trough in initial claims and the U3 unemployment rate in the labor market, and immediately ahead of the end of the curve inversion, the beginning of the recession and the beginning of rate cuts. Of course, the word " immediately " has a specific meaning here, as the cycles are usually spread long over time (not applicable for day trading 😊).


28-Sep-2023. Where are we in the cycle? Part 2. In today's cycle, it is very important to distinguish whether the market is playing an inflationary or deflationary narrative. Therefore, the first chart compares the sequence/path of today's cycle with the median paths of historical deflationary cycles (4 cycles from 1986 to 2020) and inflationary cycles (4 cycles from 1967 to 1986). Additionally, it also shows the median path for all 10 cycles (i.e. from 1954 to 2020). We are clearly closer to historical inflationary cycles. This is visible in the "speed" of the cycle (counting from the start of tightening by the FED). Even the recent S&P500 peak on July 31 matches the relatively quickly occurring peaks of the S&P500 in inflationary cycles. Additionally, if the Fed's July hike was the last one, then the current declines in stocks also fit in with inflationary cycles - where stocks generally fell after the last rate hike (as opposed to deflationary cycles, when stocks continue to rise after the last Fed’s hike). But on the other hand, the whole narrative related to a strong economy and higher rates for longer, or the soft landing or no landing scenarios, is more suited to deflationary cycles - then, at least from a historical perspective, we would still have quite a lot of time for possible further increase of S&P500. The next 3 charts show the cycles and median paths for all 10 cycles, 4 inflationary ones and 4 deflationary ones.


Cycle 2022 - 2024

Cykl 2022-2024 nie należy do standardowych. W zasadzie jest całkowiecie inny od historycznych przykładów. Jeżeli spaski akcji w 2022 roku zaliczymy do cyklu podwyżek stóp przez FED z lat 2022-23 - to pierwszy raz w historii mamy przypadek, kiedy "górka na S&P500 nastąpiła jeszcze przed pierwszą podwyżką stóp, a "dołek" nastąpił jeszcze przezd ostatnią podwyżką. Jednakże spadki rynku akcji w 2022 roku możemy zaklasyfikować jako "pomyłkę" rynku w związku z gwałtownie rosnącą inflacją i gwałtownymi podwyżkami stóp przez FED (klasyczna reakcja rynku, jak w przykłądach inflacyjnych cykli z lat 70-tych). Niemniej gospodarka nei podażyła za rynkiem akcji i nie mieliśmy recesji w 2022 roku (wręcz przeciwnie - 2022 można określić jako "soft landing"), dlatego rynki akcji musiały wrócić w okolice poprzednich szczytów.
Cycle 2015 - 2020

2-Oct-2023. The 2015-2020 cycle began traditionally with slow rate increases, and the entire tightening cycle lasted 3 years. The S&P500 continued to rise, including a pause and during the 3 rate cuts in 2019. Things moved very quickly during the Covid recession. Then strong bull market. Interestingly, inflation began to seriously disturb the stock market only in March 2022, when it exceeded 8%. Today, the S&P500 is roughly at the same level, with inflation at 3.67%.
Cycle 2004 - 2008
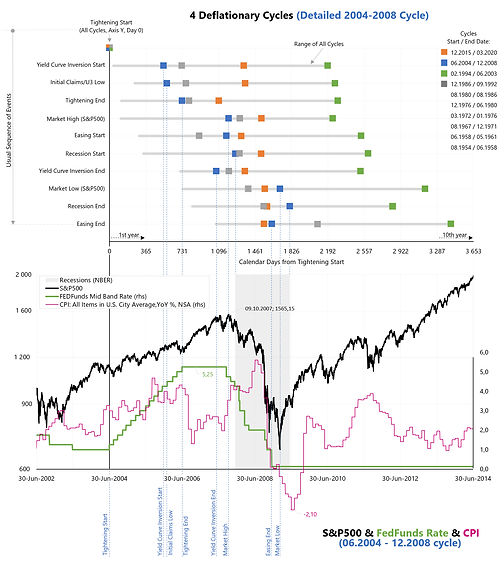
2-Oct-2023. In the 2004-2008 cycle, after the Fed ended the interest rate hikes, the pause lasted as long as 15 months. In today's cycle, the market is currently pricing in a pause of 12 months (the first cut will take place only on July 31, 2024). The S&P500 rose throughout the pause in 2006-07 and peaked only after the first rate cut by the FED.
Cycle 1994 - 2003
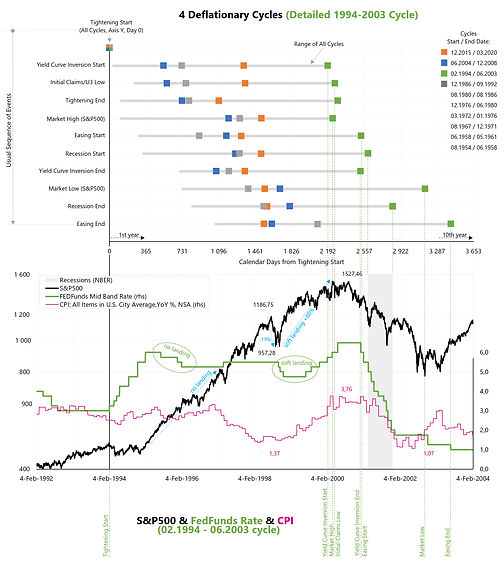
2-Oct-2023. The 1994-2003 cycle was the last time the FED managed to make a soft landing: the S&P500 fell some 19% in 1998, the FED cut rates three times, then a pause and more rate hikes (thas time the FED did not have to lower rates to "zero"). From the bottom in 1998, the S&P500 rose another 60% before the bull market ended. Of course, there was no problem of inflation. If we were to have a soft landing in today's cycle, it would be similar - after a 25% correction in 2022, the S&P500 could continue to grow to new peaks. However, the market always plays soft landing first... before moving on to the hard landing narrative. A perfect example is the 1st rate cut on January 3, 2001, which came as a surprise... it was not a planned FOMC meeting. On that day, the Nasdaq Composite increased by 14.2%!. Needless to say, Wall Street's enthusiasm was the perfect opportunity to sell, as the Nasdaq then fell by more than 60% to the bottom of the cycle.
Cycle 1980 - 1986

2-Oct-2023. The 3rd and 4th inflationary cycles of the 1970s (1976-80 and 1980-86) were quite extreme in terms of the level and change of inflation, or the federal fund rate. But not necessarily extreme for equities. After recovering from the 1974 recession, the S&P 500 rose 73% (September 1976, Chart 2), and then at the bottom of the 1982 recession it was about the same level - despite two subsequent recessions. Why wouldn't the stock go even lower? Both valuations have already become very attractive, but with such high inflation there was also a significant difference between the nominal and real levels of the S&P500. From the peak of 1968 to the trough of 1982, the S&P500 nominally dropped only 5.5% (Chart 1), but in real terms it was down by 65.7% (nominal S&P500 deflated by US CPI). Similarly, the real S&P500 from the low of October 3, 1974 to the low of August 12, 1982 fell by only 14.7%. Chart 3 shows the detailed path/sequence of the 1976-80 cycle, and Chart 4 shows the 1980-86 cycle. What finally beat inflation was the Fed's rate significantly exceeding the annual inflation rate for a long period of time. In fact, from 1981 to the end of the 1980s, the FED rate was on average 4.8 percentage points above the annual inflation rate, and the FED reduced interest rates very slowly (the easing cycle ended only in 1986).


Cycle 1976 - 1980

2-Oct-2023. The 3rd and 4th inflationary cycles of the 1970s (1976-80 and 1980-86) were quite extreme in terms of the level and change of inflation, or the federal fund rate. What finally beat inflation was the Fed's rate significantly exceeding the annual inflation rate for a long period of time. In fact, from 1981 to the end of the 1980s, the FED rate was on average 4.8 percentage points above the annual inflation rate, and the FED reduced interest rates very slowly (the easing cycle ended only in 1986).
Cycle 1972 - 1976

2-Oct-2023. The 1972-76 cycle it was less pleasant. The CPI increased from 2.71% in June 1972 to 12.34% in December 1974. Today we know a whole list of reasons why the Fed's interest rate of only 13% for a short period of time, and then quickly lowered to below 5%... had no chance of defeating inflation. The S&P500 plunged 48.2% (January 1973 - October 1974), and only made up for the (nominal) losses in July 1980. To finally overcome inflation, two more monetary cycles (1976-80 and 1980-86), two recessions (1980 and 1981-82) and another wave of inflation (14.76% peak in March 1980) were needed.
Cycle 1967 - 1971

2-Oct-2023. Attached a chart showing the first two inflationary cycle of the 1970s: 1967-1971 . The 1967-1971 cycle was more standard - no one suspected the upcoming major problems with inflation. The CPI increased from 2.43% in October 1967 to 6.20% in December 1969. But the financing of the war in Vietnam and the increase in social spending in the second half of the 1960s did their job. Welfare spending amounted only to 1.32% of GDP in 1966, and already 2.35% in 1972 and 4.01% in 1977. Such an increase in the "quantity of dollars in circulation” forced the suspension of the convertibility of the dollar into gold in 1971 and the actual collapse of the Bretton Woods system from 1944. Interestingly, the root cause of inflation, as a rule, is always the same… The 1972-76 cycle it was less pleasant. To finally overcome inflation, two more monetary cycles (1976-80 and 1980-86), two recessions (1980 and 1981-82) and another wave of inflation (14.76% peak in March 1980) were needed.
We are we in the Cycle?

29-Feb-2024. Let's take a look at the updates of key charts showing where we are in the cycle (against the background of history). Figure 1 and 2 show rate cuts in previous deflationary cycles. The current cycle most rhymes with the 2006-2008 cycle (long pause, strong economy). If the length of the pause from 2007 were to repeat, then in the current cycle the first rate cut would be in October 2024 (and the third and fourth cuts, which may already raise market concerns in terms of hard landing, are January and February 2025 - i.e. ideally… just after the US elections. Figure 3 shows four scenarios for the S&P500 (calculated since the last rate hike): soft landing, two variants of hard landing and crash landing. Currently, we are closest to deflationary hard landings, as shown in Figure 4. If the closest comparison is to the 2006-2008 cycle, Figure 5 shows the 10-year US Treasury yield. Figure 6 is the USD Dollar Index. In the current cycle, I would not expect the dollar to weaken until the end of the pause (as was the case, for example, in 2007 - when Emerging Markets and commodities were very strong), because this time the US economy is the strongest. So the dollar is rather neutral until the end of the pause / or till the 2nd-4th rate cut by the FED. And then, if there were to be a hard landing, I would expect a classic strengthening of the dollar up to the previous peak of 2022 (114 points on the dollar index, or well below parity on the EURUSD rate).


