PL Macro

15-year Stock Returns

14-May-2023. Inwestujemy w akcje przez ostatnie 15 lat i liczymy naszą stopę zwrotu w PLN. Lepiej zarobić rocznie 17,4%, czy 0,9%? Innymi słowy lepiej zarobić w tym okresie 1075% czy 15%? Jeżeli polska złotówka w długim okresie powoli osłabia się względem USD i EUR – to ma to też swoją dużą zaletę! Nasze stopy zwrotu z aktywów w USD i EUR będą wyższe! Np. to niezły sposób na ochronę przed inflacją 😊. Od 31.12.2007 (do 12.05.2023) złotówka osłabiła się do USD o 70,2% - a do EUR o 25,5%. To oznacza, że rocznie nasza stopa zwrotu (wyrażona w PLN) była wyższa o 3,52% (dla USD) i 1,49% (dla EUR). A to bardzo bardzo dużo w okresie 15 lat! Jeżeli ktoś zainwestował w Nasdaq100 to jego roczna stopa zwrotu wyniosła 17,38%, a w przypadku WIG30 TR jedynie 0,91%. Całkowita stopa zwrotu w PLN w przypadku Nasdaq 100 to 1075%, a dla WIG30 TR jedynie 14,9% (wszystko w złotówkach). Dla porównania stopa zwrotu dla S&P500 w tym samym okresie to 548%; dla MSCI ACWI (all countries word index) 280%, a dla WIG20 TR niestety jest ujemna i wyniosła -5,5%. Oczywiście temat na osobny wpis to: który indeks akcyjny wybrać na kolejne 15 lat i jakie wady ma inwestowanie pasywne.. i jakie zalety ma inwestowanie aktywne (bo mam wrażenie, że „wszyscy” znają dobrze tylko wady inwestowania aktywnego i tylko zalety inwestowania pasywnego).


WIG30 > S&P500

15-May-2023. W nawiązaniu do moich poprzednich postów: na polskich akcjach też można zarobić sporo więcej niż na amerykańskich (nawet gdy liczymy stopy zwrotu w PLN). Ale takie sytuacje są rzadkie (historycznie) i występują po wcześniejszych dużych spadkach. Idealnie gdy mamy do czynienia z mocnym odbiciem risk-on, oczekiwanym przyspieszeniem wzrostu, początkiem cyklu, albo po prostu z silnym „reflation trade” itp., itd. Na wykresie pokazuje okresy kiedy 6-miesięczna stopa zwrotu z WIG30TR (w złotówkach) jest wyższa o co najmniej 20 punktów procentowych od 6-miesięcznej stopy zwrotu z S&P500TR (w złotówkach). Taka różnica w stopach zwrotu jest „wystarczająco zachęcająca” nawet na bazie 6 miesięcy… Aby strategia miała szansę, kupić należy 6 miesięcy wcześniej 😊 to oczywiste 😊, ale dla ułatwienia na wykresie ten okres zaznaczyłem na niebiesko (na linii WIG30TR). Praktycznie działa „zawsze” po dużych korektach. W 2020 i 2021 też ten efekt wystąpił (na mocnym odbiciu rynków), ale słabiej… bo nie przebił progu 20 pp (dokładniej w kwietniu 2021 dojechaliśmy do 16 pp na korzyść WIG30TR; a w X 2021 dojechaliśmy do 20 pp (przez 1 dzień było powyżej 20 pp, to jest zaznaczone na wykresie) – wtedy „zakupy” należałoby wykonać odpowiednio w X 2020 i w marcu 2021). Temat na osobny post to lata 2002-2007, czyli złote lata dla akcji polskich i z Emerging Markets (i jakie są szansę, że się powtórzą, albo nie).
PL GDP vs US GDP

17-May-2023. Co ma wspólnego polski PKB z amerykańskim PKB? Oba rosą całkiem mocno.. nominalnie (i realnie też). Ale wzrost nominalny łatwiej porównać z stopą procentową banku centralnego, która też jest wyrażana nominalne. W gospodarce po-pandemicznej, nominalny wzrost PKB w Polsce to 13-18% rok do roku (przy stopie NBP 6,75%), w USA nominalny wzrost w Q1 2023 to 7% (przy stopie FED-u 5,25%), a wcześniej nawet 17%. Pokonanie inflacji w USA (od 1980 roku) oznaczało utrzymanie stopy banku centralnego powyżej nominalnego wzrostu PKB także poza recesjami (lata 1980-1991), a podczas recesji 1980-1982 stopa FED-u była nawet o 10 pp wyższa od nominalnego PKB. Amerykanie pewnie w Q3 2023 będą już mieć wyższą stopę FED-u niż nominalny wzrost PKB, a u nas taka perspektywa daleko przed nami.. Podobnie dłuższa jest też perspektywa pokonania inflacji. W Polsce w latach 2012-2013 stopa NBP była wyższa zarówno od stopy inflacji jak i nominalnego wzrostu PKB i w kolejnych latach mieliśmy nawet deflację.


PL Wages Nominal & Real

21-Jun-2023. Poland. Median salary increased by 12.2% (year-on-year) in May, but that doesn't mean we're getting rich. In March 2021 it was the last time when inflation was below the upper limit of the inflation target (3.5%). Since then, real mean salary has fallen by 7.05% (-3.32% per year). From January 2010 to March 2021, real salary grew by 3.36% per year! That's a lot. However, in the near future, we're not likely to see real salary growth.


>2% & >3% EUR/PLN Moves

7-Sep-2023. The zloty (PLN) weakens significantly against the Euro, mainly after yesterday's central bank decision to cut interest rates by 75 bps (the market expected only 25 bps). CPI for August 2023 was 10.1% YoY and Core CPI around 10.0% -10.2% respectively. 2-day periods of zloty depreciation by more than 2% against Euro are quite rare - see the chart.

7-Sep-2023. PLN depreciation - update. During the press conference of the central bank, the zloty jumped to a level above EUR/PLN 4.63 (intraday). At this exchange rate, the 2-day change (depreciation) is over 3%! Historically, there have been only a few such two-day cases (exactly 6 after the GFC of 2008-2009) - see the graph.
>5% EUR/PLN moves

7-Sep-2023. PLN depreciation - update 2. Since the low of the EUR/PLN exchange rate (4.404 on July 31 this year), we are already over 5% higher today (intraday). Historically, the zloty has rarely weakened by more than 5% in one move.. (and rarely strengthened by more than 5%) - see chart.

12-Sep-2023. Today's weakening of the zloty is a total of 6.65% since the last low on the EURPLN exchange rate. Recently, we had a greater weakening only after the outbreak of the war in Ukraine (10.81%) and during Covid-19 (9.28%).
Polish Reflation Trade

8-Sep-2023. Polish stocks. During global risk-on, reflection trade, etc. Polish equities usually grow very strongly. For example, from the low in October 2022 to the high in July 2023, the iShares MSCI Poland ETF USD increased by 94% and the WIG20USD index by 100%. However, due to unexpected interest rate cuts and the weakening of the Polish currency, the correction from July 31 high is gaining momentum (as of September 7 close): WIG20USD: -18.8% iShares MSCI Poland ETF USD: -16.7% WIG20 PLN: -12.1% At the same time: S&P500 USD: -3.0% iShares MSCI Emerging Market ETF USD: -6.9%


WIG20 Real & Nominal

3-Oct-2023. 2022-23: WIG20 real vs nominal. In Poland, as well as in other CEE countries, inflation was much higher than in the USA. The peak of the annual inflation in Poland was 18.4% (vs. 9% in the USA). Therefore, the difference between the real and nominal series is much larger in Poland. In other words, the attractiveness of Polish stocks (in real terms) are relatively much higher. We are talking about a nominal drop from the market top of 24.2% - and in real terms the drop was 39.7%.
NBP second interest rate cut

4-Oct-2023. Poland. Second interest rate cut. Today we had the second interest rate cut in Poland (from 6.0% to 5.75% and in total after two cut we are already 100 bps lower). The Polish currency strengthened significantly immediately after the announcement (the market expected a cut of 25 bps, but there were fears it could be more). However, throughout the day the Polish currency strengthened only by 0.32%, while the Hungarian forint strengthened today by 0.51% and the Czech koruna by 0.46% respectively (RON unchanged today). Therefore, the Polish currency has strengthened less today than other currencies in the region. Since the first cut on September 6, the Polish zloty has been significantly weaker than other CEE currencies (first chart). The second chart shows the full tightening cycle in the CEE region.

PLN round trip

11-Oct-2023. The Polish Zloty (PLN) has recently made a round trip … After the first rate cut (75 bps, so 3x more than the market expected) there was a strong weakening vs EUR, then after the second cut there was a strong strengthening... On the charts: PLN & the CEE currencies vs EUR and the CEE FX Basket of equal-weight of CZK, HUF and RON vs EUR.


Polish assets (30-Oct-2023)

30-Oct-2023. Polish financial assets have been behaving very well for 4 weeks and contrary to global trends. Exactly 2 weeks ago the general elections were held in Poland (and the market shot up the day after). The main Polish stock indices have broken the global downward trend and, for example, WIG20USD has increased by 20.3% since October 3, 2023 (in this period, the S&P500 is down 1.4%) - see chart 1. Polish banks have increased even more since October 3, 2023, by as much as 27.7% (Chart 2). This is also in spite of the main downward trend for European banks (-5.1% in this period) and American banks (-0.96% S&P500 Financial) - see chart 2.

Flash CPI (Oct-2023)
%20PNG.png)
31-Oct-2023. Poland. Flash CPI for October: 6.5% YoY Annual inflation change down to 6.5% (from 8.2% in September) and down from the cycle peak of 18.4% in February 2023. But in general, it should be remembered that energy and gas prices are administratively frozen, and fuel prices at gas stations in October dropped around the general elections, which means they should increase in November (precisely "Fuel for private means of transport" dropped in October by 4.2% MoM). Inflation in Poland is falling, as in other CEE countries, however the key will be the next months and in which countries it will remain sticky and at higher levels, and in which it will move towards the inflation targets. In Poland, inflation looks stickier for now.
Polish assets & elections

12-Nov-2023. Summary of recent asset returns. Polish assets. Polish assets have been performing very well since the beginning of October (2 weeks before the parliamentary elections), and the election results only accelerated outperformance (Chart 1). Index WIG Banks increased by 31% in this period, and the main equity index WIG20 expressed in USD increased 22.5%. The Polish currency also strengthened against the EUR by approximately 4.7%. The Polish currency also strengthened compared to the basket of regional currencies, especially after the general elections (Chart 2).

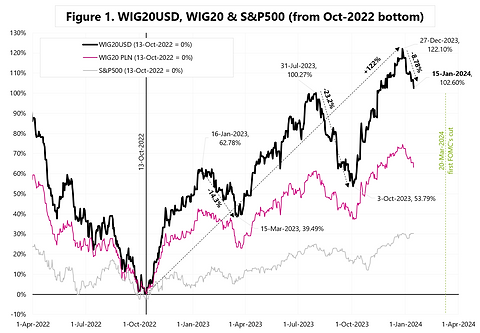

WIG20USD Risk-off

17-Jan-2024. Risk-off on markets and a strong dollar. Since December 28, the dollar has strengthened almost to pre-FED pivot levels (December 13, 2023). And one of the most sensitive sentiment measures are Polish shares expressed in U.S. dollars … WIG20USD Index. After yesterday's session, the decline in WIG20USD is already 10.1%. Additionally, yesterday the dollar strengthened against the PLN by over 1.1%. Figure 1 shows the declines in the stock index and the increase in USDPLN, highlighting the days when such an increase was greater than 1.0% and greater than 1.5%. As you can see in the chart, an increase in USD of over 1% is not yet a "big deal".
PLN Santa Rally?

26-Dec-2024. Stronger PLN at the end of the year? When it comes to stronger asset prices at the end of the calendar year, such a seasonal effect is widely known in the case of the stock market (or at least expected by investors every year). In the case of the EURPLN exchange rate, it can be said that since 2017 the zloty has shown an annual tendency to strengthen against the euro (counting from October 31 to January 31 of each year) - see Figure 1. However, this does not apply to the years 2014-2016. In general, the zloty should be stronger when global stock markets are also stronger. In the current year 2024, so far the zloty strengthened against the euro by 2% from October 31 to December 26 (however, it is currently at the same level as in September 2024). Figure 2 shows the change in the EURPLN exchange rate from October 31 to January 31 in the years 2014-2023. Figure 3 shows the same, but each year has been rebased to the zloty level on October 31, 2024. Figure 4 shows the change in the EURPLN exchange rate in 2024 relative to the 2014-2023 average, and the 2017-2023 average. All in all, one can count on a seasonally stronger zloty (against the euro) in November/December, but this is not a strong and regular seasonal pattern.


A Porche with no Brakes PLN

25-Feb-2025. A Porsche with no brakes.. unstoppable PLN Since the US presidential election, the Polish PLN has strengthened against the EUR by 4.8%. This is more than the S&P500 increased during the same period (only +3.47%). Of course, this is not an apples-to-apples comparison. The realized volatility of the PLN (calculated over the last 3 months) is 3.7% (annualized value), while the S&P500 is 12.7%. This means that the S&P500 is almost 4 times more volatile (risky). So +4.8% in the case of PLN - this is an equivalent of the S&P500 of as much as +11.8%. The PLN is definitely the strongest compared to other currencies in the CEE region - see Figure 1. Interestingly, since November 5, 2024, the PLN has been strengthening both when the EURUSD falls and when it rises... see Figure 2 (this is historically unprecedented). If the main driver of PLN strength is the approaching peace in Ukraine... then in the event of a war breaking out in 2022... PLN has only weakened by 2.2% (apart from the initial spike) - see Figure 3. While this is not directly comparable, it is quite thought-provoking... that the outbreak of war weakened PLN by 2.2% - and the end has already strengthened PLN by almost 5%. Figure 4 shows CEE currencies since the beginning of the rate hike cycle in the region, i.e. since 22 June 2021. HUF has weakened by 13.6% since then, and PLN has strengthened by 8.5%. Interest rate cuts (plus expectations regarding the future path of monetary policy) have a significant impact on the strength of CEE currencies - in the case of CZK we do not see such a significant strengthening, but rather weakening since April 2023 - see Figure 5.


