The Mag 10+
Revenues & Gross Margins

30-Jul-2023. GOOGL, MSFT, TESLA, AAPL, META: Revenue & gross margin Comparison of revenue volume (TTM - trailing twelve months) and TTM YoY revenue growth, as well as gross margin on sales (i.e. gross profit / revenue) - see charts... Tesla is the smallest company (volume of sales), but also the fastest growing with revenue growth of 40% - so it is a typical growth company. The remaining companies are rather difficult to classify as classic growth companies (they are too big and mature), where TTM revenues grow around 0% (Apple, Meta), and 4-7% (Microsoft, Alphabet). It can even be said that these are already cyclical companies, where the increase in revenues largely depends on the growth of the entire economy… What is interesting, however, is the profitability of business measured by the gross margin, which ranges from 18% (Tesla) to as much as 81% (Meta). Meta with such a profitable business can aggressively finance new product lines that generate approximately $4 billion in operating loss per quarter.


Revenue vs Nominal GDP

31-Jul-2023. GOOGL, MSFT, TESLA, AAPL, META: revenue growth vs nominal US GDP growth On the trailing 12 month basis (see chart 1), in Q2 2023 only Tesla's revenue is growing faster than nominal GDP. Below the increase in YoY revenues in Q2 for individual companies: Tesla: +40,0% Nominal US GDP: +7,5% Microsoft: +6,9% Alphabet: +4,1% Meta Platforms: +0,9% Apple: -1,17% (assuming 80,9 bln USD of revenues in Q2). Nevertheless, it should be remembered that in 2021 the revenues of these companies grew up like a weed after the pandemic stimuli, so it is also worth comparing the increase in cumulative revenues from Q4 2019 (see chart 2): Tesla: +238% Alphabet: +62% Microsoft: +52% Meta Platforms: +52% Nominal US GDP: +24% Apple: -12% (assuming 80,9 bln USD of revenues in Q2). Apple looks particularly uninteresting, although one should remember about strong seasonality here, and that the strongest quarter is Q4, not Q2, so we are not directly comparing apples to apples :), but even if we compare YoY growth for quarterly revenues (see chart 3), Q2 2023 will be the 7th quarter in a row for Apple with sales growth lower than the nominal growth of US GDP.


Mag7 after Q2 2023 Results

6-Aug-2023. How did the market assess the quarterly results of the largest US companies? The biggest positive surprise is Amazon +8.8% against the S&P500. The worst Tesla -10.9% against the S&P500. See the charts META, GOOGLE, AMZN above expectations, APPL, MSFT, TESLA below expectations.

Does Mag7 trade implodes?

29-Oct-2023. The Mag7 trade implodes? Over the weekend, you can read a little about changing sentiment and narrative regarding the Mag7, which boosted the entire market this year. And while the Mag7 dropped more than the S&P500 in the last two weeks (however in the last week it dropped even less than the S&P500), looking from the beginning of the current correction (31-Jul-2023), the Mag7 index still outperforms the S&P500 - see chart 1. How individual companies behave during this period... see chart 2. Microsoft and Amazon, after strong Q3 results, have fallen only slightly and so far uphold the entire Mag7 club. Of course, looking at the returns since the beginning of the year (Chart 3), a larger correction/mean-reversion for the Mag7 club could certainly be due. Links to Amazon Q3 results: https://lnkd.in/dwYvqqqn https://lnkd.in/dswAUziN Link to Microsoft Q3 results: https://lnkd.in/dN7w4555


Nifty Seven / Nifty Eight

1-Nov-2023. Nifty Seven. Nifty Eight. Nifty Fifty. -4.14% is how much the S&P500 Equal-weights fell in October (-3.84% from the beginning of the year). However, the largest companies are doing much better: 1) Nifty Seven (aka The Magnificent 7) in October -0.34% and +60.35% in 2023, YTD (market-cap weights) in October -2.86% and +79.06% in 2023, YTD (equal weights) 2) Nifty Eight (aka The Enormous 8 - Mag7 + Netflix) in October -0.14% and +60.22% in 2023, YTD (market-cap weights) in October -1.26% and +74.62% in 2023, YTD (equal weights) 3) Nifty Fifty (aka S&P500 Top 50) in October -1.41% and +21.25% in 2023, YTD (market-cap weights) After the fantastic results for Q3 2023, the best returns in October were Microsoft (+7.08%), Amazon (+4.70%), and Netflix (+9.03%). Tesla reported poor results (-19.73% in October). What is missing? Apple (tomorrow) and Nvidia results (21-Nov-2023). In Apple's case, disappointment may come from relatively lower sales in China. In the case of Nvidia, expectations are high regarding results, and for example AMD after reporting Q3 result (despite good results for Q3) scared a little bit the market with the too low revenue guidance for Q4 (approximately $6.1 billion, plus or minus $300 million which was below the Wall Street estimate of $6.4BN).
Mag7+, Q3 2023 Rundown

6-Nov-2023. The Mag7+ short wrap-up of Q3 results. Of the 7 companies, only Tesla failed to beat Wall Street's revenue growth expectations. All companies beat the EPS forecast (Amazon by as much as 62%). With revenues of $143B per quarter, Amazon can grow at a rate of +12.6%! The table shows details about revenues and EPS, as well as how the price of a given company behaved after the announcement of Q3 results. Tesla disappointed the most, while Amazon was the best performer (see also the chart). Based on Factset data (as of November 3), here are Q3 results for the entire S&P500 (for companies that have already reported): 1) the blended (combines actual results for companies that have reported and estimated results for companies that have yet to report) earnings growth for the third quarter is 3.7% 2) the blended revenue growth rate for the third quarter is 2.3% So, The Mag7+ are performing much better than the S&P500 with average earnings growth +62%, and average revenue growth +13,8%.

The Mag7 YTD Returns

4-Dec-2023. The Mag7. 2023 YTD return. Of course, all seven companies beat the S&P500. The highest return since the beginning of the year is Nvidia +211%. The weakest Apple +46%. S&P500 only +19%. Figure 1. In October, the highest Microsoft +7.1%. The weakest is Tesla -19.7%. S&P500 -2.2%. In November, the highest was Tesla +19.5%. The weakest is Alphabet +6.8%. S&P500 +8.9%. Returns for the last two months combined (October + November): the highest Microsoft +20.0%. The weakest is Tesla -4.1%. S&P500 +6.5%. Figure 2. In the case of Microsoft, the last two months returns are the result of great results for Q3 2023 (link to earnings review below text). Similarly in the case of Tesla, poor Q3 results are making themselves felt... (link to earnings review below text).

Relative to S&P500 (Q3 2023)


8-Dec-2023. Mag7 & Novo Nordisk. How do companies from the Mag7 club behave after the publication of results for Q3 2023? On average, neutral relative to the S&P500 (see the chart). 3 companies are above the S&P500 (Amazon, Microsoft, Apple), the rest are below. Yesterday, Alphabet rose 5.3% after announcing the launch of the new Gemini AI model (and here are the first tests of the model, including with a blue rubber duck: link below the text). Revenues for the entire S&P500 increased by 2.4% YoY in Q3, and EPS by 4.8%. In the table below the graph, I also include Wall Street's expectations for Q4 2023 earnings. Revenue dynamics in Q4 is expected to increase for Alphabet, Microsoft, Apple and Nvidia. The dynamics of profits (EPS) is expected to increase in Alphabet, Meta, Amazon and Novo Nordisk. On the subject of AI... Nvidia's revenues are expected to grow by ... 230% YoY and EPS by 410%. For the entire S&P500, revenues are expected to increase by 3.1% in Q4 and profits by 3.0%.
23-Oct-2023. Mag7+ How do individual companies perform after the publication of Q3 2023 earnings? From the date of publication to the closing price on November 22, 2023... the top outperformer is Amazon (+12.56% relative to the S&P500, and nominally +22.7%). Tesla is the weakest (-9.1% relative to the S&P500, and nominally -3.49%).
Relative to S&P500 (Q4 2023)
8-Dec-2023. Counting from the earnings publication for Q4 2022 (Tesla started the season on January 25, 2023), all companies from the Mag7 club, as well as the largest European company Novo Nordisk, beat to date the S&P500 (Figure 1), the most: Nvidia nominally +128.9% and +109.6% relative to the S&P500, Meta nominally +117.3% and +105.5% relative to the S&P500, Tesla nominally +68.8% and +54.2% relative to the S&P500, and the weakest: Alphabet nominally +25.3% and only +15.1% relative to the S&P500. Similarly, since the result publication for Q1 2023, all companies have also beaten the S&P500 (Figure 2). After the publication of Q2 2023 earnings, 4 companies beat the S&P500, 2 are neutral and 2 worse than the S&P500 (all calculations at prices as of December 8, 2023). After the publication of results for Q3 2023, only 3 companies have beaten the S&P500, the remaining 5 are behaving worse than the S&P500. If on January 25 we bought 7 companies from the Magnificent 7 club (in equal weights), our portfolio would earn 77.6% by December 8 (bottom panel of Figure 1). If we had a more conservative approach and bought according to weights depending on the capitalization of a given company (the largest is Apple, the smallest is Tesla), we would earn 65.2%. Historically, outperformance and higher valuations of the largest companies (aka nifty-fifty) lasted for years. Of course, after such increases, these companies now have a higher beta and can easily fall more than the S&P500 (e.g. the decline in October of the Mag7 (equal weights) was 2.9% (S&P500 -2.2%), but the rebound in November: Mag7 +11.9% and S&P500 +8.9%.


Alphabet Q2 2023 review

26-Jul-2023. Alphabet (Google) delivered very strong results for Q2, which at the same time turned out to be well above Wall Street expectations, so the share price is now 6-7% above yesterday's close (pre-market). In Q2, +4.4% YoY revenue growth was expected, and it was +7.1% (+ USD 4.9 bln)! The main contributors to revenue growth are Google Search (+4.8% YoY, +1.9 bln USD), Google Cloud (+28.0% YoY, +1.8 bln USD), and Google Other (+24.2% YoY, +$1.6 bln USD). Google Other are mainly YouTube nonadvertising revenues, primarily from subscription growth in YouTube Music, Premium, and YouTube TV, followed by growth in hardware revenues. The result conference call was mainly about AI. In virtually every aspect of business, the company can use / or already uses AI. Sundar Pichai, CEO: “At I/O (annual developer conference), we shared how we are making AI helpful for everyone in four important ways. First, improving knowledge and learning (…) we intuitively know how to incorporate AI into our products (…). This quarter saw our next major evolution with the launch of the Search Generative Experience, or SGE, which uses the power of generative AI to make Search even more natural and intuitive (…) Ads will continue to play an important role in this new search experience . Many of these new queries are inherently commercial in nature. Second, we are helping people use AI to boost their creativity and productivity. One example is Bard, our experiment in conversational AI. Since launching in March, it continues to get better. Third, we are making it easier for others to innovate using AI. One way is by providing Google Cloud's high-performance infrastructure, optimized for a range of generative AI models. Finally, we are making sure we develop and deploy AI technology responsibly.”


Alphabet Q3 2023 preview

24-Oct-2023. Alphabet. Q3 2023 earnings (short) preview. Today, after the market close, Alphabet will publish Q3 2023 earnings. Publishing its results for Q2 in July this year, Alphabet surprised Wall Street in a strongly positive way (+3% sales surprise and +9.1% EPS surprise). As a result of such earnings, Alphabet's stock performed the best of all Mag7 companies since the publication of Q2 results - Alphabet beat the S&P500 by as much as 19.4% - see chart 1. From 25-Jul-2023 to 23-Oct-2023: Alphabet +11.7%, S&P500 -7.7%, so Alphabet relative to S&P500 +19.36% (corresponding to S&P500 at the level of 5033.67 on October 20 - see chart 1). What are analysts' expectations regarding Q3 results: Revenue: $75.99 bln (+9.98%, was $69.09 bln in Q3 2022) – see chart 2. EPS: 1.45 (+38.8%, was 1.06 in Q3 2022).

Alphabet Q3 2023 review

25-Oct-2023. Alphabet. Earnings Q3 2023 review. Alphabet generally beat revenue expectations on every line except its Google Cloud segment: 1) Total Revenue: $76.69 bln (+0.92% Sales surprise, chart 1), 2) Revenue ex-TAC: $64.05 bln (+1.60% Sales surprise, chart 2), TAC – Traffic Acquisition Costs: the portion of revenues shared with Google’s partners and amounts paid to distribution partners and others who direct traffic to the Google website, 3) Google Cloud: $8.41 bln (-2.21% Sales surprise, chart 3). Google Cloud has been the key catalyst behind the company's growth on the back of its strengthening cloud service offerings. And this is a market segment with stiff competition. So negative surprise here is hurting. Google's cloud offerings include Google Cloud Platform and Google Workspace. 4) EPS $1.55 per share (+6.90% beat). So at this moment Alphabet is down 6.1% in after-hours trading.


25-Oct-2023. Alphabet. Earnings Q3 2023 review. Part 2. If lower-than-expected revenue growth in the Google Cloud segment resulted in a decline in the stock price (in after-hours), it is worth checking how it was commented during the earnings conference. And there were questions about the slowdown in this segment. Sundar Pichai, CEO: “ (…) On Cloud, maybe what I would say is, overall, we had definitely started seeing customers looking to optimize spend. We leaned into it to help customers given some of the challenges they were facing. And so that was a factor. But we are definitely seeing a lot of interest in AI. There are many, many projects underway now, just on Vertex alone, the number of projects grew over 7x. And so we see signs of stabilization, and I'm optimistic about what's ahead”. Ruth Porat, CFO: “Turning to the Google Cloud segment. Revenues were $8.4 billion for the quarter, up 22%. GCP (“Google Cloud Platform”) revenue growth remained strong across geographies, industries and products, although the Q3 year-on-year growth rate reflects the impact of customer optimization efforts. Google Workspace also delivered strong revenue growth, primarily driven by increases in average revenue per seat. Google Cloud had operating income of $266 million, and the operating margin was 3%.” “(…) as it relates to Cloud, as Sundar said, what we're really excited about is the revenue growth does reflect healthy customer adoption across the portfolio, and that's infrastructure, data analytics, security. And so we’re -- I can't comment on others, but we feel good about where we're sitting here and looking forward, and we'll let you do the forecasting. DCP growth in the third quarter was above the growth rate for Cloud overall, and we feel really good about the work that they're doing there. And then, of course, in addition to that is all of the contribution from Google Workspace.”
Alphabet Q1 2024 review

29-Apr-2024. Alphabet Q1 2024 earnings review My key takeaways: 1) Alphabet rose by more than 10% after the results announcement to a new all-time high. The results were very good and practically beat expectations across the board: +1.9% beat – Total Revenues of $80.54 billion (expected $79.0 billion), Figure 1, +2.6% beat – "Google Search & Others" revenues at the level of $46.16 billion (expected $45.0 billion), Figure 2, +4.7% beat – "YouTube Ads" revenues of $8.09 billion (expected $7.73 billion), Figure 3, +2.5% beat – "Google Advertising" revenues of $61.66 billion (expected $60.18 billion), Figure 4, +2.1% beat – "Google Cloud" revenues of $9.57 billion (expected $9.37 billion), Figure 5, 2) The main threat to Aplhabet is a possible change in users' preferences in using search engines and replacing them with popular AI chatbots that answer questions rather than provide links to other websites. Today, this threat is not visible in numbers, but the success of integrating the search engine with AI tools will be crucial here. Sundar Pichai, CEO: „AI innovations in Search are (…) perhaps the most important point I want to make. We have been through technology shifts before - to the web, to mobile and even to voice technology. Each shift expanded what people can do with Search and led to new growth. We are seeing a similar shift happening now with generative AI. (…) now, we’re starting to bring AI overviews to the main search results page. We are being measured in how we do this, focusing on areas where gen AI can improve the Search experience, while also prioritizing traffic to websites and merchants. (…) based on our testing, we are encouraged that we are seeing an increase in Search usage among people who use the new AI overviews, as well as increased user satisfaction with the results”. On SGE (search generative experience) and Search: “ (…) we are seeing early confirmation of our thesis that this will expand the universe of queries where we are able to really provide people with a mix of factual answers, linked to sources across the web and bring a variety of perspectives, all in an innovative way. And we have been rolling out AI overviews in the U.S. and U.K., trying to mainly tackle queries, which are more complex where we think SGE will clearly improve the experience.” 3) Alphabet showed good results in the Cloud segment, where YoY growth accelerated to 28% (+$2.12 billion YoY). Google Cloud generates revenues primarily from consumption-based fees and subscriptions received for Google Cloud Platform services, Google Workspace communication and collaboration tools, and other enterprise services. 4) Alphabet also showed a large CAPEX (purchases of property and equipment) in Q1 in the amount of $12.12 billion (expected $10.2 billion), but this did not disturb investors (in the case of Meta, the large CAPEX was cited as a negative factor). Additionally, full-year run-rate CAPEX will be at least at the Q1 level or higher, i.e. >$48 billion in 2024 (expected $43.1 billion). 5) To maintain good investor sentiment, Alphabet also announced the initiation of a cash dividend program, and declared a cash dividend of $0.20 per share that will be paid on June 17, 2024. The company intends to pay quarterly cash dividends in the future, subject to review and approval by the company's Board of Directors in its sole discretion. Additionally, Alphabet's Board of Directors authorized the company to repurchase up to an additional $70.0 billion of its Class A and Class C shares.


Alphabet Q2 2024 preview

22-Jul-2024. Alphabet Q2 2024 preview. Alphabet reports earnings after the market close on July 23. Wall Street expects: - revenues of $84.353 billion (this means YoY +13.1% and QoQ +4.7%) - revenues excluding TAC at the level of $73.203 billion (this means YoY +17.9% and QoQ +8.3%) - Google Cloud revenues at the level of $ 10.089 billion (this means YoY +25.6% and QoQ +5.4%) - diluted EPS at $ 1.84 (this means YoY +27.8% and QoQ -2.65%). Figure 1 shows the change in consensus regarding future revenues. After the publication of the results for Q1 2024, the revenue forecast decreased by 0.7% to 3.2% (change from April 19 to May 15). However, the consensus as of July 22 is already higher (than the one from May 15) from 1.7% to 2.7%. Figure 2 shows the Wall Street consensus on EPS estimate for each quarter. Figure 3 additionally shows the company's reported EPS. Whereas Figure 4 shows EPS starting from October 2023.


Alphabet Q2 2024 review

28-Jul-2024. Alphabet Q2 2024 earnings review. During earnings call the word “AI” was mentioned 91 times (“only” 65 times during Q1 2024 call). The best summary of Q2 2024 results is as follows: 1) Strong business performance, especially in Search and Cloud, 2) Strong AI investment and leadership, 3) Many examples of AI use at both the consumer and enterprise level, but it is still too early for (wide) monetization of AI. Alphabet beat the revenue consensus for the 6th quarter in a row, in Q2 2024 Wall Street expected $84.35 billion, Alphabet delivered $84.74 billion (+0.5% beat). See Figure 1. Other key data: -2.5% miss: “Revenues excluding TAC” $71.36 billion (expected $73.20 billion), Figure 2, +1.8% beat: "Google Search & Others" revenues $48.509 billion (expected $47.638 billion), Figure 3, -3.2% miss: "YouTube Ads" revenues of $8.663 billion (expected $8.946 billion), Figure 4, -5.5% miss: "Google Network" revenues of $7.44 billion (expected $7.87 billion), Figure 5, +0.2% beat: "Google Advertising" revenues of $64.616 billion (expected $64.518 billion), Figure 6, +2.6% beat: "Google Cloud" revenues of $10.347 billion (expected $10.088 billion), Figure 7, +2.7% beat: EPS diluted $1.89, estimate $1.84, Figure 8 Sundar Pichai, CEO: “(…) we are uniquely well-positioned for the AI opportunity ahead. Our research and infrastructure leadership means we can pursue an in-house strategy that enables our product teams to move quickly. Combined with our model building expertise, we are in a strong position to control our destiny as the technology continues to evolve. Importantly, we are innovating at every layer of the AI stack, from chips to agents and beyond, a huge strength”. On Google Search: “With AI, we are delivering better responses on more types of search queries and introducing new ways to search. We are pleased to see the positive trends from our testing continue as we roll out AI Overviews, including increases in Search usage and increased user satisfaction with the results. People who are looking for help with complex topics are engaging more and keep coming back for AI Overviews”. On Waymo (autonomous ride-hailing service): “Waymo served more than 2 million trips to date and driven more than 20 million fully autonomous miles on public roads. Waymo is now delivering well over 50,000 weekly paid public rides, primarily in San Francisco and Phoenix. And in June, we removed the wait list in San Francisco, so anyone can take a ride. Fully autonomous testing is underway in other Bay Area locations without a human in the driver seat”. AI will take some time… to unlock value: “ (…) if you take a look at our AI infrastructure and generative AI solutions for cloud across everything we do, be it compute on the AI side, the products we have through Vertex AI, Gemini for Workspace and Gemini for Google Cloud, etc., we definitely are seeing traction. People are deeply engaging with the Gemini models across Vertex and AI studio. We now have over 2 million developers playing around with these things, and you are definitely seeing early use cases. But I think we are in this phase where we have to deeply work and make sure on these use cases, on these workflows, we are driving deeper progress on unlocking value, which I'm very bullish will happen. But these things take time. But if I were to take a longer-term outlook, I definitely see a big opportunity here”. On the AI capex: “I think the one way I think about it is when we go through a curve like this, the risk of under-investing is dramatically greater than the risk of over-investing for us here, even in scenarios where if it turns out that we are over-investing, we clearly -- these are infrastructure which are widely useful for us. (…) But I think not investing to be at the front here, I think, definitely has much more significant downside”.


Alphabet Q3 2024 review

31-Oct-2024. Alphabet Q3 Earnings Review. The market rewarded the good results and Alphabet's share price grew even more than 7%, but finally closed the first day of trading after the results with an increase of 2.85% (S&P500 -0.33%). My key takeaways: 1) Firstly, very good results vs Wall Street expectations, practically beating across the board, 2) Secondly, 35% YoY growth of Google Cloud, with Q3 revenues at $11.35 billion (+5.2% beat vs expectations of $10.79 billion), 3) Thirdly, wide adoption of GenAI, which is starting to bring business effects (AI is starting to "work" in every product line), 4) Of course, one should remember the earlier drop in the price from 191.75 (ATH, July 10) to the bottom of 147.2 (September 9) by 23%, then the price rose to 161 on October 24 - in such a context, it is easier to get a positive market reaction (similarly with Tesla after the publication of results). Additionally, in the 3 days prior to the publication of the results (October 24 to 29), Alphabet rose by 4.33% (S&P500 +0.4% for the same period) – which can also be considered a kind of front-running of good results. Sundar Pichai, CEO on an AI virtuous cycle: “(…) investment in AI are paying off (…) We are uniquely positioned to lead in the era of AI because of our differentiated full stack approach to AI innovation, and we are now seeing this operate at scale. It has three components. First, a robust AI infrastructure that includes data centers, chips and a global fiber network. Second, world-class research teams who are advancing our work with deep technical AI research and who are also building the models that power our efforts. And third, a broad global reach through products and platforms that touch billions of people and customers around the world, creating a virtuous cycle.” One can only imagine what would have happened to products and platforms if Alphabet had not invested in AI. Figure 1 shows Google Search & Other revenue Figure 2 shows YouTube Ads revenue Figure 3 shows Google Network revenue Figure 4 shows Google Advertising revenue (Google Search & Other + YouTube Ads + Google Network) Figure 5 shows Google subscriptions, platforms, and devices revenue Figure 6 shows Google Services Total revenue (Google Advertising + Google subscriptions, platforms, and devices) Figure 7 shows Google Cloud revenue Figure 8 shows Alphabet revenue (Google Services Total + Google Cloud + Other Bets + Hedging gains/losses) Figure 9 shows Alphabet revenue ex TAC (traffic acquisition cost).


Alphabet Q4 2024 Review

7-Feb-2025. Alphabet generally showed solid results in Q4, but slightly below expectations for total revenue (0.16% miss) – see Figure 1. But the most important thing was the miss on Google Cloud (a whopping 1.93%) – see Figure 2. The main reason for lower revenue was supply constraints, which prevented Alphabet from meeting the high demand related to AI (negative in the short term, however positive in the long term). Anat Ashkenazi, CFO: “On the Cloud question, first, I'm excited that we ended the quarter at $12 billion and a 30% year-over-year growth. Very impressive growth. And as I've mentioned in the prepared remarks, GCP grew at a much higher rate than overall Cloud. Two items to think about from a deceleration perspective, the first is we are lapping a very strong quarter [in] AI deployments in Q4 2023. The second is the one you've alluded to. We do see and have been seeing very strong demand for our AI products in the fourth quarter of 2024. And we exited the year with more demand than we had available capacity. So we are in a tight supply-demand situation, working very hard to bring more capacity online. As I mentioned, we've increased investment in CapEx in 2024, continuing to increase in 2025. And we'll bring more capacity throughout the year”. Alphabet spent $14 billion on CapEx in Q4 2024, but Capex will increase significantly in 2025. Anat Ashkenazi, CFO: “Ss we expand our AI efforts, we expect to increase our investments in capital expenditure for technical infrastructure, primarily for servers, followed by data centers and networking. We expect to invest approximately $75 billion in CapEx in 2025, with approximately $16 billion to $18 billion of that in the first quarter.” Finally, Sundar Pichai, CEO, commented on DeepSeek: “A couple of things I would say are, if you look at the trajectory over the past three years, the proportion of the spend towards inference compared to training has been increasing, which is good, because obviously inference is to support businesses with good ROIC. And so I think that trend is good. I think the reasoning models, if anything, accelerates that trend, because it's obviously scaling upon inference dimension as well. And so, look, I think part of the reason we are so excited about the AI opportunity is we know we can drive extraordinary use cases, because the cost of actually using it is going to keep coming down, which will make more use cases feasible, and that's the opportunity space. It's as big as it comes, and that's why you're seeing us invest to meet that moment.”


Amazon Q2 2023 review

5-Aug-2023. Amazon Q2 2023 results. Key takeaways: 1) Amazon definitely beat market expectations regarding revenue growth, YoY revenue increased by +10.8% in Q2 2023 (market expected +8.6%), additionally, the company forecasts revenue growth in Q3 of +10.5% (and the market expected only +8.8%) 2) The AWS (Amazon Web Services) segment showed revenue growth of +12.2% YoY (market expected +10.0%). This is an important segment, investors feared a larger decline in sales here due to customers still cutting IT costs - but this segment has stabilized since May and there is no further slowdown. In Q1, AWS grew 16%, but during the earnings conference, the company reported a decrease in AWS sales growth by 5 points down in April 2023 alone - which caused Amazon's share price to fall. The good news is that in Q3 we can expect a continuation of the trend from Q2. CFO, Brian Olsavsky: “(…) April was running about 500 basis points lower than Q1. What we've seen in the quarter is stabilization and you see the final 12% growth. (…) So, while that is 12%, there's a lot of cost optimization dollars that came out and a lot of new workloads and new customers that went in. (…) What we're seeing in the quarter is that those cost optimizations, while still going on, are moderating, and many maybe behind us in some of our large customers. And now we're seeing more progression into new workloads, new business. So, those balanced out in Q2. We're not going to give segment guidance for Q3. But what I would add is that we saw Q2 trends continue into July. So, generally feel the business has stabilized.” 3) Amazon delivered further improvement in retail margins in Q2 with “North America” segment operating margin up for 5th consecutive quarter and “International” segment up for 3rd quarter in a row 4) As for AI monetization, it will be rather slow… CEO Andy Jassy: “I think when you're talking about the big potential explosion in generative AI, which everybody is excited about, including us, I think we're in the very early stages there. We're a few steps into a marathon in my opinion. I think it's going to be transformative, and I think it's going to transform virtually every customer experience that we know. But I think it's really early. I think most companies are still figuring out how they want to approach it. They're figuring out how to train models. They want to -- they don't want to build their own very large language models. They want to take other models and customize it and services like (Amazon) Bedrock enable them to do so. But it's very early, and so I expect that will be very large, but it will be in the future.”


Amazon Q3 2023 review

28-Oct-2023. Amazon. Q3 earnings review. The day after the results were published, Amazon's price jumped +6.8% nominally and +7.31% relative to the S&P500. These are the second quarterly results in a row that were very well received by investors. Since the announcement of the results for Q2 (3-Aug-2023), Amazon's price is +7.6% relative to the S&P500 (and nominally -0.91%), see chart 1 and 2. My two key takeaways on Q3 2023 earnings, a kind of “big picture” to memorize: 1) Revenue beat, both just reported Q3 and Q4 2023 revenue guidance 2) All operational margins up! Additionally what’s also important: 3) In minus, a bit lower AWS (Amazon Web Services) revenues 4) In plus, nicely growing Advertising business segment 5) Of course, strong EPS beat and free cash flow 6) And more positive news about Generative AI (during earnings conference call) Re. 1) Amazon reported Q3 Total Revenue of $143.08 billion (+0.97% beat of Wall Street estimate), which gives an annual change of +12.6%. The company forecasts revenues in Q4 in the range of $160-167 billion, Wall Street expected $157 billion (beat +1.9% to +6.4%), chart 3. Re. 2) All operating margins increased YoY and sequentially quarter over quarter. Gross margin increased +286 bps YoY. See chart 4. Brian Olsavsky (CFO) during conference call on North America segment profitability: “North America operating income was $4.3 billion, an increase of $4.7 billion year over year, resulting in an operating margin of 4.9%, up 100 basis points quarter over quarter (…) The third quarter marked the second full quarter of regionalization within the U.S., and we're pleased with the early results. Regionalization has allowed us to simplify the network by reducing the number of line-haul lanes, increasing volume within existing line-haul lanes and adding more direct fulfillment center to delivery station connections. We have also been focused on optimizing inventory placement in a new regionalized network, which when coupled with the simplification mentioned earlier, is helping contribute to an overall reduction in cost to serve. Additionally, in the quarter, we saw benefits from lower inflation, primarily within line haul, ocean and rail shipping rates, which were partially offset by higher fuel prices” And on International segment: “In international, we were closer to breakeven during the quarter with an operating loss of $95 million. This was an improvement of $2.4 billion year over year. This improvement was primarily driven by lowering our cost to serve through higher productivity, decreased inflationary pressures and improvements in leverage across our established and emerging international countries” And on AWS (Amazon Web Services): “Our operating margin for the quarter was 30.3%. This is an improvement of approximately 600 basis points quarter over quarter, primarily driven by increased leverage on our headcount costs.”


28-Oct-2023. Amazon. Q3 earnings review. Part 2. What was a minor disappointment in the Q3 results was that AWS's cloud segment revenues grew below expectations (although the negative surprise was only 0.3%) - see chart 1. And this segment also contains all of the future artificial intelligence growth. Maybe the revenue miss was small, but if we look at the growth in this segment over the last 4 quarters and compare it to the growth of Microsoft's Intelligent Cloud... so Amazon is slightly behind Microsoft, see chart 2 (in Q3 2022, Amazon's revenues were $213m higher than Microsoft's ones - and in Q3 2023 Microsoft's revenues are $1.2b higher). My key takeaways: 1) Based on the company's comments during the earnings call and general optimism surrounding AWS's prospects, AWS's current slower revenue growth may look like a "temporary blip", 2) AWS's very good prospects should be looked at in two dimensions: (i) "cloud is early" and (ii) "generative AI is very early" - that is, not only generative AI is at an early stage of development, but also cloud... (despite that today's "run rate" of this business for Amazon is $92 billion per year), 3) The development of Generative AI is also a big challenge for Amazon’s customers: large models turn out to be expensive, their practical use is complicated, and most customers do not have experienced AI experts. Andy Jassy, Amazon’s CEO: “If you think about 90% plus of the global IT spend being on-premises, where I think that equation is going to flip in 10 years. I think cloud is early. So, if you -- with that lens on, I still think we're very early in generative AI.” Andy Jassy on some challenges of large AI models: “a lot of companies figure out quickly is that using the really large -- the large models and the large sizes ends up often being more expensive than what they anticipated and what they want to spend on that application. And sometimes too much latency in getting the answers as it shovels through the really large models.” “still it's complicated to actually figure out which models you want to work, you want to use and how you actually want to employ them and trying to make sure you have the right results, trying to make sure you get safe results, trying to make sure you end up with a cost structure and a customer experience that you want. And so, it's hard. And customers will like -- there's a certain number of customers who have very deep AI expert practitioners, but most companies don't.”

Amazon Q1 2024 review

1-May-2024. Amazon Q1 2024 earnings review My key takeaways: 1) Total revenues increased by 12.5% YoY (above expectations, but only +0.51% beat), but at the same time the company's guidance for Q2 disappointed ... mid-range is only $146.5 billion, which means a 2.46% miss - see Figure 1. The "North America" segment performed slightly better +0.83% beat - see Figure 2. However, the "International" segment was disappointing - 1.57% miss - Figure 3. 2) But the most important segment for investors, AWS (amazon web services), was the strongest! Beating expectations by as much as 3.81% - see Figure 4. YoY growth accelerated to 17.2% (from 13.2% in Q4 2023). Figure 5 shows a comparison of the cloud businesses of Microsoft and Google. About AWS, Andy Jassy, CEO: “We remain very bullish on AWS. We're at $100 billion-plus annualized revenue run rate, yet 85% or more of the global IT spend remains on-premises. And this is before you even calculate GenAI, most of which will be created over the next 10 to 20 years from scratch and on the cloud.” „We're seeing a few trends right now. First, companies have largely completed the lion's share of their cost optimization and turned their attention to newer initiatives (…) Our AWS customers are also quite excited about leveraging GenAI to change the customer experiences and businesses. We see considerable momentum on the AI front” About 3 layers of GenAI: “(…) we continue to add capabilities at all three layers of the GenAI stack. At the bottom layer, which is for developers and companies building models themselves, we see excitement about our offerings. We have the broadest selection of NVIDIA compute instances around, but demand for our custom silicon, training, and inference is quite high, given its favorable price performance benefits relative to available alternatives (…) The middle layer of the stack is for developers and companies who prefer not to build models from scratch, but rather seek to leverage an existing large language model, or LLM, customize it with their own data, and have the easiest and best features available to deploy secure high-quality, low-latency, cost-effective production GenAI apps. This is why we built Amazon Bedrock (…) Bedrock already has tens of thousands of customers, including Adidas, New York Stock Exchange, Pfizer, Ryanair, and Toyota. In the last few months, Bedrock's added Anthropic's Claude 3 models, the best-performing models in the planet right now; Meta's Llama 3 models; Mistral's Various models, Cohere's newest models, and new first-party Amazon Titan models. (…) The top of the stack are the GenAI applications being built. And today, we announced the general availability of Amazon Q, the most capable generative AI-powered assistant for software development and leveraging company's internal data. On the software development side, Q doesn't just generate code, it also tests code, debugs coding conflicts, and transforms code from one form to another. Today, developers can save months using Q to move from older versions of Java to newer, more secure and capable ones.” 3) Margins are up significantly! Gross margin and operating margin are the highest in recent years. AWS margins have also increased to historic levels. See Figure 6. 4) Capex is up significantly! Of course, just like in Tesla, Alphabeth, Microsoft, Meta – it's mainly AI related! CEO: „We expect the combination of AWS' reaccelerating growth and high demand for GenAI to meaningfully increase year-over-year capital expenditures in 2024, which given the way the AWS business model works is a positive sign of the future growth. The more demand AWS has, the more we have to procure new data centers, power and hardware. And as a reminder, we spend most of the capital upfront. But as you've seen over the last several years, we make that up in operating margin and free cash flow down the road as demand steadies out. And we don't spend the capital without very clear signals that we can monetize it this way.” Brian Olsavsky, CFO: “As a reminder, we define these as the combination of capex plus equipment finance leases. In 2023, overall capital investments were $48.4 billion. As I mentioned, we're seeing strong AWS demand in both generative AI and our non-generative AI workloads, with customers signing up for longer deals, making bigger commitments. (…) We anticipate our overall capital expenditures to meaningfully increase year over year in 2024, primarily driven by higher infrastructure capex to support growth in AWS, including generative AI.”


Amazon Q4 2024 review

11-Feb-2025. Amazon’s 2025 CAPEX? Try $105bln! The positives include generally solid results in Q4 2024 and growing margins, while the negatives include slightly weaker AWS revenues in Q4 2024 and weaker-than-expected guidance for Q1 2025. First, Amazon shares beat the S&P500 by 21% between the publication of Q3 2024 and Q4 2024 results (i.e. from October 31, 2024 to February 6, 2025), which is enough to make us expect a pause for now... (such performance also boosted market expectations for Q1 2025). Figure 1 shows Amazon's relative performance to the S&P500 after the publication of subsequent quarterly results. As a rule, underperformance is small (as in the period after the publication of Q1 and Q2 2024 results), while overperformance can be large... as a result, Amazon beat the S&P500 by a cumulative 61 percentage points... counting from the publication of Q4 2022 results (i.e. from February 2, 2023 to February 10, 2025 - see Table 1). In Q4 2024, Amazon beat expectations regarding total revenue (Figure 2) and margin (Figure 3). AWS did slightly worse (Figure 4). AWS has about a 35% share of the global cloud market. On the other hand, Amazon disappointed with its guidance for Q1 2025: -net sales are expected to be $151.0 billion to $155.5 billion, below the estimate of $158.64 billion, and -operating income $14.0 billion to $18.0 billion, below the estimate of $18.24 billion CAPEX in 2025 is impressive... as much as $105bn - with Wall Street expecting only $86bn. That's more in 2025 than Meta ($60-65bn), Alphabet ($75bn) and Mircrosoft (some $88bn in 2025FY). Andrew R. Jassy , CEO: “Capital investments were $26.3 billion in the fourth quarter. And we think that run rate will be reasonably representative of our 2025 capital investment rate. Similar to 2024, the majority of the spend will be to support the growing need for technology infrastructure. This primarily relates to AWS, including to support demand for our AI services, as well as tech infrastructure to support our North America and international segments. Additionally, we're continuing to invest and capacity for our fulfillment and transportation network to support future growth. We're also investing in same-day delivery facilities and our inbound network, as well as robotics and automation, to improve delivery speeds and to lower our cost to serve. These capital investments will support growth for many years to come.” Amazon is quite optimistic about AI, which is “the biggest opportunity”: “And while it may be hard for some to fathom a world where virtually every app has generative AI infused in it, with inference being a core building block just like compute, storage, and database, and most companies having their own agents that accomplish various tasks and interact with one another, this is the world we're thinking about all the time. And we continue to believe that this world will mostly be built on top of the cloud with the largest portion of it on AWS. (…) AI represents, for sure, the biggest opportunity since cloud and probably the biggest technology shift and opportunity in business since the Internet”. And Amazon could have been growing faster: “It is hard to complain when you have a multibillion-dollar annualized revenue run rate business in AI, like we do, and it's growing triple-digit percentage year over year. It's hard to complain. However, it is true that we could be growing faster, if not for some of the constraints on capacity. And they come in the form of, I would say, chips from our third-party partners, come a little bit slower than before with a lot of midstream changes that take a little bit of time to get the hardware actually yielding the percentage healthy and high-quality servers we expect”. And some comments on DeepSeek: “First of all, I think like many others, we were impressed with what DeepSeek has done. I think in part impressed with some of the training techniques, primarily in flipping the sequencing of reinforcement training -- reinforcement learning being earlier and without the human-in-the-loop. We thought that was interesting ahead of the supervised fine-tuning. We also thought some of the inference optimizations they did were also quite interesting. For those of us who are building frontier models, we're all working on the same types of things and we're all learning from one another. (…) if you run a business like AWS and you have a core belief like we do, that virtually all the big generative AI apps are going to use multiple model types, and different customers are going to use different models for different types of workloads. You're going to provide as many leading frontier models as possible for customers to choose from. That's what we've done with services like Amazon Bedrock. And it's why we moved so quickly to make sure that DeepSeek was available both in Bedrock and in SageMaker faster than you saw from others”.


Apple Q2 2023 review

4-Aug-2023. Apple Q2 2023 results. As expected, it's a bit of a boring quarter for Apple's earnings. However, there are 3 things to note: 1) Constantly decreasing revenue growth. YoY revenue decreased by 1.4% (with 4 percentage points of FX headwind), the forecast for Q3 is a similar decline in YoY (-1.4%), but FX will subtract only 2 percentage points - i.e. revenue decline accelerates on a constant currency basis. 2) But in return, the profitability of the business is growing and the gross margin in Q2 was the highest in history 44.5% Luca Maestri, CFO: “(…) the 44.5% for the June quarter is an all-time record for us in June. We were up 20 basis points sequentially. It was driven by cost savings and a mix shift towards Services, which obviously helps company gross margins, partially offset by the seasonal loss of leverage. We have a commodity environment that is favorable to us. Our product mix is quite strong at this point. (…) we expect a similar level of gross margins for the same reasons, frankly, for the September quarter.” 3) In order to somehow justify the company's high valuation, "everyone is focused" on current and future growth drivers ... such as: - increase in sales in Emerging Markets, - affordability programs - various forms of crediting/sales promotion, - growth of Services, - AI, very important, but there will be no super breakthrough here, - new products, such as Vision Pro Timothy Cook: “There's enormous excitement around the Vision Pro. We're excited internally. Everybody that's been through the demos are blown away, whether you're talking about press or analysts or developers. (…) I'm using the product daily”. All in all, it is difficult to justify today's valuation of Apple from the financial point of view and the company's (short/medium-term) growth potential. The valuation premium simply depends on other factors…


Apple is down 8.96%

8-Aug-2023. Apple is down 8.96% from the recent high, and since it is the largest company, it necessarily has a large impact on the entire market. Weaker financial results for Q2 2023 took their toll.. However, after previous quarterly results, Apple usually outperformed the S&P500 in style: Q1 2023: +4.69% APPL next day +1.85% S&P500 next day Q4 2022: +2.44% APPL next day -1.04% S&P500 next day Q3 2022: +7.56% APPL next day +2.46% S&P500 next day Q2 2022: +3.28% APPL next day +1.42% S&P500 next day Q1 2022: -3.66% APPL next day -3.63% S&P500 next day .. but not today: current quarter Q2 2023: -4.80% APPL next day -0.53% S&P500 next day


two bad days -6.4%

8-Sep-2023. Apple's share price had two bad days in a row (-6.4% and the S&P500 only -1.0%). And one of the famous sayings is “As Apple goes … goes the market”. The iPhone ban in China is the main reason to blame. But let's also remember about the weak Q2 results. Revenues from China (Greater China Revenue Segment) constitute 19.3% of total revenues. Moreover, this segment's YoY growth is 7.9% in Q2 2023, while total revenues contracted by 1.4% in Q2 YoY (chart). Attached are some charts.


Apple Q3 2023 review

6-Nov-2023. Apple. Q3 2023 (calendar) results review (it was formally Q4 2023 for Apple). My 3 main takeaways: 1) The results were rather poor, generally slightly below expectations, and the most important thing... the company is not growing: this is the 4th quarter in a row of decline in YoY revenues, 2) the guidance for Q4 2023 means 0% YoY revenue growth (supposedly an improvement, but Wall Street expected +5%), let's also remember about high inflation when it is relatively easier to achieve nominal revenue growth 3) However, the market does not care too much: since the results were announced, Apple's share price is only 1.46% down relative to the S&P500. Apple has had periods of revenue decline like this before (see the chart, top panel): 1) In 2016, TTM (12-month trailing) revenues decreased by 8.3%. Then came the recovery on TTM sales +23.9% (mainly due to the increase in iPhone sales) 2) In 2019, TTM revenues decreased by 2.7%. Then came a weak rebound in TTM sales of +6.2% (mainly due to the increase in sales of Services and Wearables+) 3) Strong growth 2020-22, TTM revenues increased +43.6% (mainly due to growth in iPhone and Services sales) TTM's current revenue decline YoY is 2.8%. For Apple to make another jump in revenues, it will probably need a significant increase in iPhone sales again... Weaker sales in China do not help either, which in Q3 turned out to be as much as USD 2 billion below Wall Street's expectations. ------------------------ Some more color on revenue growth: it’s fair to say that the strong dollar reduced Apple's sales expressed in USD both in Q3 and the entire fiscal year (last 4 quarters). Foreign exchange had a negative impact of over 2 percentage points in September quarter, and some 3 points over the full reporting year. So, on constant-currency basis it was 0+ revenue growth. Similarly, in China, negative FX impact was nearly 6 points in September quarter. Attention should also be paid to shifts between quarters in the sales of new product versions, as well as shifts related to supply chain disruptions. This especially applies to Mac and iPad sales, which moved from Q2 to Q3 in 2022 – so Q3 YoY comparison is a little bit flawed.
Apple Q4 2023 review

5-Feb-2024. Apple December 2023 quarter earnings review. Part 1. Will the latest technological marvel, Vision Pro glasses, save Apple this year? Apple Vision Pro is available in U.S. stores starting Friday, February 2. There is no doubt about customer delight, but sales volume will be important for investors. This product has the potential to drive the company's revenue growth in 2024. Yet, the lack of significant growth or even the risk of a decline in revenues is the company's main challenge and the main risk for investors that at some point the share price may react negatively. My key takeaways form recent earnings release: 1) Apple's total sales in Q4 2023 grew only 2.1% year-over-year. But in Q4 2022, due to disruptions in supply chains, iPhone sales were approximately $5 billion lower, and this demand was only met in Q1 2023. In other words, $5 billion in sales moved from Q4 2022 to Q1 2023. If we take this effect into account in the comparison of Q4 2022 and Q4 2023, instead of a 2.1% increase we would get a 2.1% decrease in sales. Since nothing in nature is lost, we will formally see this effect in the decline in sales in the first quarter of 2024. And now the analysts' consensus forecast of Apple's revenues in the calendar Q1 2024 is USD 92.5 billion, which means a year-on-year decline of 2.5% - see Figure 1. Figure 2 shows the dollar contributions to the annual change in revenues – by business segments. iPhone added USD 3.9 billion, but if we added USD 5 billion in sales to Q4 2022 - the contribution would be negative. 2) Apple is making up for the lack of sales growth with higher gross profit margin, which has increased from levels of around 38% in 2020 to the current 45.9%. Apple forecasts its further growth in calendar Q1 2024 to the range of 46-47% - see Figure 3. 3) Weak sales in China are a concern (Figure 4). Well-known Apple analyst from TF International Securities, Ming-Chi Kuo recently stated that the new paradigm in phone design includes the use of artificial intelligence and foldable phones, and the main reason for the decline in Apple sales on the Chinese market is the growing interest in foldable phones (which Huawei benefits from). According to Ming-Chi Kuo, shipments of iPhone 15 series and new iPhone 16 series will decline by 10-15% y/y in the first and second half of 2024, respectively.


5-Feb-2024. Apple earnings review. Part 2. Continuation of part one: In turn, at the beginning of January 2024, Barclays analysts lowered their recommendations for Apple to "underweight" with a target price of $160. Analysts expect weaker iPhone sales (both in terms of volume and sales mix), and no rebound in Mac, iPad and Wearables. Weaker sales in China in particular will weigh on results. In the case of Mac and iPad, sales may fall to pre-pandemic levels: "These two products combined were basically showing no growth pre-Covid, but are still running 20-30% above those levels despite the rest of the industry correcting." See Figure 5 and 6. Additionally, Barclays analysts expect some deceleration in Services, with regulatory risk ramping. “We model ~10% and ~8%growth in Services in FY24 and FY25, well below prior growth estimate of ~20%. In 2024, we should get an initial determination on the Google TAC, and some app store investigations could intensify.” See Figure 7. So what can have a positive impact on Apple in 2024? Apple Vision Pro will certainly be sold, not only to retail but also commercial customers. Luca Maestri, CFO Apple during the results conference: “Leading organizations across many industries such as Walmart, Nike, Vanguard, Stryker, Bloomberg, and SAP have started leveraging and investing in Apple Vision Pro as their new platform to bring innovative spatial computing experiences to their customers and employees. From everyday productivity to collaborative product design to immersive training, we cannot wait to see the amazing things our enterprise customers will create in the months and years to come.” In the field of artificial intelligence, Apple - unlike other companies - does not provide greater details, but announced that in 2024 it will show what steps the company has taken in this regard. Market expectations in this area are very high. Tim Cook, CEO of Apple during the earnings conference: “As we look ahead, we will continue to invest in these and other technologies that will shape the future. That includes artificial intelligence where we continue to spend a tremendous amount of time and effort, and we're excited to share the details of our ongoing work in that space later this year.” Tim Cook on the high price of Apple Vision Pro: “(…) from a price point of view, there's an incredible amount of technology that's packed into the product. There's 5,000 patents in the product and it's, of course, built on many innovations that Apple has spent multiple years on, from silicon to displays and significant AI and machine learning. All the hand tracking, the room mapping, all of this stuff is driven by AI. And so, we're incredibly excited about it. I can't wait to be in the store for tomorrow and see the reaction myself.”


Apple Q1 2024 review

4-May-2024. Apple March Quarter 2024 Earnings Review My key takeaways: 1) First, it's going to be flat nominal growth at best. And this in an environment of high inflation. Investors should probably get used to this. The company is too large for any new and innovative products to significantly accelerate the growth of total revenues (in the short term). 2) If investors "accept flat growth" - then practically all other important factors related to the company are fine and solid - starting from a strong brand, customer satisfaction, market position, margins, further products, Vision Pro, expectations regarding AI applications, growing dividend and increasingly larger share buybacks, etc. Tim Cook, CEO: „In services, we set an all-time revenue record, up 14% over the past year. Keep in mind, as we described on the last call, in the March quarter a year-ago, we were able to replenish iPhone channel inventory and fulfill significant pent-up demand from the December quarter COVID-related supply disruptions on the iPhone 14 Pro and 14 Pro Max. We estimate this one-time impact added close to $5 billion to the March quarter revenue last year. If we remove this from last year's results, our March quarter total company revenue this year would have grown.” And about GenAI: „We continue to feel very bullish about our opportunity in Generative AI. We are making significant investments, and we're looking forward to sharing some very exciting things with our customers soon. We believe in the transformative power and promise of AI, and we believe we have advantages that will differentiate us in this new era, including Apple's unique combination of seamless hardware, software and services integration, groundbreaking Apple's silicon, with our industry-leading neural engines and our unwavering focus on privacy” And the remaining takeaways: 3) Revenues decreased YoY by 4.8% and this is the 5th quarter of negative annual growth over the last 6 quarters - see Figure 1. A year ago, approximately $5 billion in iPhone sales moved from Q4 2022 to Q1 2023 - if we adjusted the results for this, then Q4 would be negative (-2.1%) and the current quarter positive (+1.02%). It is also worth noting the significant decline in Wall Street expectations regarding Apple's revenue growth - see Figure 2 (and comparison of the consensus change from February to April 2024). 4) Year over year, Apple recorded revenue growth only on Mac sales (+$0.28 billion YoY) and Services (+$2.96 billion) - see Figure 3. The remaining product categories were negative year over year - see Figure 4. 5) To counterbalance and somehow satisfy shareholders... Apple increased its share buyback program to $110 billion and also increased its dividend by 4% to $0.25 per share. 6) Revenues may not be growing as investors would like, but in return the gross profit margin is constantly growing - and in Q1 it reached as much as 46.6% - see Figure 5. This is due to growing margins in services (and falling margins on products) - see Figure 6. Luca Maestri, CFO: „Company gross margin was 46.6%, up 70 basis points sequentially, driven by cost savings and favorable mix to services, partially offset by leverage. Products gross margin was 36.6%, down 280 basis points sequentially, primarily driven by seasonal loss of leverage and mix, partially offset by favorable costs. Services gross margin was 74.6%, up 180 basis points from last quarter due to a more favorable mix.” 7) Investors pay a lot of attention to the Chinese market (there were a lot of questions about China at the results conference). Sales in the Chinese market decreased YoY by 8.1% (-$1.44 billion). This is a smaller decline than in the previous quarter, when it amounted to -12.9%. See Figure 7. However, the company remains optimistic about the Chinese market… Tim Cook: „(…) if you look at our results in Q2 for Greater China, we were down 8%. That’s an acceleration from the previous quarter in Q1. And the primary driver of the acceleration was iPhone. And if you then look at iPhone within Mainland China, we grew on a reported basis. That’s before any kind of normalization for the supply disruption that we mentioned earlier. And if you look at the top-selling smartphones, the Top 2 in Urban China are iPhones. And while I was there, it was a great visit and we opened a new store in Shanghai and the reception was very warm and highly energetic (…). And so I maintain a great view of China in the long-term. I don’t know how each and every quarter goes and each and every week. But over the long haul, I have a very positive viewpoint.”


Apple Q4 2024 Review

4-Feb-2025. Apple Intelligence – a game changer? In general, Apple showed weak results for the calendar 4th quarter of 2024 (some say better than feared). The most disappointing were sales in China… where revenues fell 11% YoY. Nevertheless, the next quarter may be a bit better… the company expects YoY revenue growth of “low to mid single digits” – and this is after deducting the effect of the strong dollar, which will take away as much as 2.5 points from the annual change in sales. Kevan Parekh, CFO: “The color we're providing today assumes that the macroeconomic outlook doesn't worsen from what we're projecting today for the current quarter. As the dollar strengthens significantly, we expect foreign exchange to be a headwind and to have a negative impact on revenue of about 2.5 percentage points on a year-over-year basis. Despite that headwind, we expect our March quarter total company revenue to grow low to mid single digits year over year. We expect services revenue to grow low double digits year over year.” Apple... on the negative side there is lack of revenue growth + problems in China, but on the positive side we have a strong brand, 2.35 billion of active devices (customer base) and the ability to offer this customer base AI services (Apple Intelligence). Can Apple Intelligence trigger another sales upgrade wave of the latest iPhone models? At least that's what investors are counting on.. and introducing Apple Intelligence to the market will take some time (e.g. preparing different language versions). In addition (or maybe it's a good thing) Apple Intelligence is only available on the latest iPhones.. (iPhone 15 Pro or iPhone 16). The next release of Apple Intelligence iOS 18.4 will be in April. Additionally, DeepSeek breakthrough can help with AI adoption on phones. Tim Cook: “In October, we released the first set of Apple Intelligence features in U.S. (...) And we were excited to recently begin our international expansion with Apple Intelligence now available in Australia, Canada, New Zealand, South Africa, and the U.K. We're working hard to take Apple Intelligence even further. In April, we're bringing Apple Intelligence to more languages, including French, German, Italian, Portuguese, Spanish, Japanese, Korean, and simplified Chinese, as well as localized English to Singapore and India. (…) we did see that the markets where we had rolled out Apple Intelligence that the year over year performance on the iPhone 16 family was stronger than those where Apple Intelligence was not available. In terms of the features that people are using, they're using all of the ones that I'd referenced in my opening comments, from Writing Tools to Image Playground and Genmoji, to visual intelligence and more.” Figure 1 shows TTM revenues and 3 growth waves... can Apple Intelligence cause a 4th wave? For a complete picture, Figure 2 shows quarterly revenues.


Meta Q2 2023 review

28-Jul-2023. Meta Platforms: also delivered strong results for Q2 2023. Not only from the macro side we see that the economy is strong, but also from the side of the results of companies such as Meta or Alphabet (in general a strong advertising market drives revenue growth). In the case of Meta, the market expected YoY revenue growth in Q2 2023 of +7.8%, and received +11.0%. In addition, in Q3 revenue growth will amount to +20.0% (the middle of the company's forecast range), while the market expected only +12.6%. Susan Li, CFO on Q2 revenue acceleration: “Within ad revenue (JJ: ad rev constitutes just 98,4% of total rev), the online commerce vertical was the largest contributor to year-over-year growth, followed by entertainment & media and CPG (…). On a user geography basis, ad revenue growth was strongest in Rest of World at 16%, followed by Europe, North America and Asia-Pacific at 14%, 11% and 10%, respectively (…). In terms of the Q2 revenue acceleration, I'd highlight there are a few factors driving that. The first is, frankly, we're lapping a weaker demand period, including the first full quarter of the war in Ukraine and the suspension of our services in Russia. Second, we saw increased supply and improvements to ad performance, including improved Reels monetization as we continue to work down the Reels revenue headwind. And third, there were lower FX headwinds for us this quarter. So those were all three things that helped drive the revenue acceleration in Q2 (…).” And Susan’s comments on Q3 and Q4 revenue acceleration: “Turning now to the revenue outlook. We expect third quarter 2023 total revenue to be in the range of $32-34.5 billion. Our guidance assumes a foreign currency tailwind of approximately 3% to year-over-year total revenue growth in the third quarter, based on current exchange rates (…). So on the further acceleration that we've guided to in Q3, first of all, I'd just point out that Q3'22 revenue declined 4.5% year-over-year so we're really lapping a much weaker demand period a year ago, and we've certainly seen demand this year stabilize and so it's really a much easier compare. We also are expecting that currency is going to flip to a 3-point tailwind from a 1-point headwind last quarter (…). In terms of what this means for Q4, we're not sharing a Q4 revenue outlook yet. There are obviously some tailwinds to year-over-year growth in Q4. Again, the same point about a weaker compare applies. And at current rates, FX would be a larger tailwind in Q4 than we're expecting it to be in Q3. But we've had sizable fluctuations in advertiser demand over the last year. It's been a pretty volatile period. So while we're seeing strong advertiser demand now and that's certainly informing our outlook, it's harder to predict as we look further forward (…).”


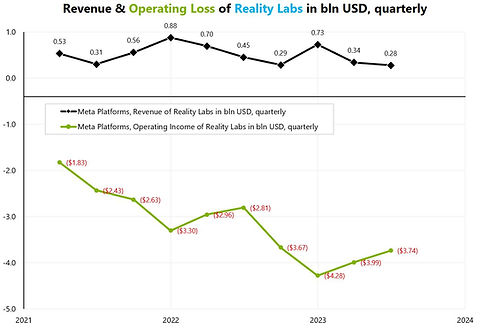
29-Jul-2023. Meta Platforms, a little more about financial results and a new business line generating huge losses. The Reality Labs business segment generates approximately $4 billion in operating loss per quarter. This is a lot, because it’s about 1/3 of the operating profit from the profitable part of the company's business (Family of Apps). Operating loss in 2022 within Reality Labs amounted to USD 13.7 billion, in 2023 it will be higher, and in 2024 according to Susan Li, CFO: "for Rality Labs, we expect operating losses to increase meaningfully year-over-year due to our ongoing product development efforts in AR/VR (JJ: Augmented Reality / Virtual Reality) and our investments to further scale our ecosystem.” So next year, the cumulative losses from Reality Labs will approach $50 billion. What does the money at Reality Labs mainly go to? The Meta doesn't provide details, but it's generally about the Quest 3 headset, VR, AR, investment in metaverse social platforms and neural interfaces. Such losses worry investors ... Goldman Sachs analyst during the earnings conference: „(…) The RL losses just continue to build. And I think we continue to struggle a little bit of what drivers of those losses are and how should we think about some of the components driving the losses versus elements of earning a return on those losses over the medium to long term”. Bank of America Merrill Lynch analyst: “I guess I want to follow up on Reality Labs, passing $40 billion in losses and increasing annually next year. Just think about -- maybe help us understand how the ROI on the business, how you're thinking about that investment, either on a stand-alone basis or as a complement to the Family of Apps, if you're thinking about it from an investor perspective.“ In response, Mark Zuckerberg: “(…) I know from an investor standpoint, most people aren't investing on quite as long of a time horizon as we are here, so I kind of get that, a lot of investors might want to see us spending less here in the near term. My view is that we are leading in these areas. I believe that they're going to be big over time. I think we've shown that we can deliver good business results in the near term while investing ambitiously in the long term. So I'm planning on continuing to do that, and I do continue to believe that over time, we will be happy that we did that.” “(…) This is a very long-term bet. At a deep level, I understand the discomfort that a lot of investors have with it because it's just outside of the model of, I think, even most long-term investors, how you would think about this. And look, I mean, I can't guarantee you that I'm going to be right about this bet. I do think that this is the direction that the world is going in. There are 1 billion or 2 billion people who have glasses today. I think in the future, they're all going to be smart glasses.”

Meta Q3 2023 review

26-Oct-2023. Meta. Q3 2023 earnings review. Immediately after the publication of the results, the Meta price increased by appr. 4% (in after-hours trading), but a few hours later it dropped to some -3% from the close of cash market. Q3 results beat expectations: 1) Total revenues amounted to $34.15 billion (+1.8% sales surprise), which means +23.2% YoY (expected +20.9%), Chart 1, 2) Advertising revenues amounted to $33.64 billion (+2.1% sales surprise), which means +23.5% YoY (expected +20.9%), Chart 2, 3) Diluted EPS $4.39 (+20.9% EPS surprise), which means +168% YoY (expected +121%). The remaining revenue segments are immaterial. Meta also reports Other Revenue (only 0.86% of total revenues), and Reality Labs revenues (only 0.62% of total revenues). Meta also reports the Family of Apps segment, which is the sum of Advertising and Other Revenue. Important points from CFO's outlook commentary: 1) Expected total revenues in Q4 2023 are $36.5-40 billion (this would mean YoY +13.5-24.4%), 2) Repeated statement from Q2 that Reality Labs' operating loss will increase YoY in 2023, 3) Repeated statement from Q2 that Reality Labs' operating loss will increase significantly in 2024: "we expect operating losses to increase meaningfully year-over-year due to our ongoing product development efforts in augmented reality/virtual reality and our investments to further scale our ecosystem", 4) They reduced the CAPEX forecast for 2023 by approximately 3% vs. the previous forecast from Q2 (to the level of $27-29 billion), 5) They provided a CAPEX forecast for 2024: $30-35 billion (the CAPEX increase is: " (...) driven by investments in servers, including both non-artificial intelligence (AI) and AI hardware, and data centers as we ramp up construction on sites with the new data center architecture we announced late last year.” Reality Laps brings huge losses. The cumulative operating loss since Q1 2021 is $35.4 billion and will exceed $50 billion next year. Fortunately, the growth of the business (the profitable part) reduces the share of the loss in the operating profit of the profitable part of the business - see chart 3.


Meta Q1 2024 review

25-Apr-2024. Meta Q1 2024 Earnings Review Meta has beaten analysts' expectations and the stock is down 15%. Go figure! Meta reported Q1 2024 Revenue of $36.46 billion (vs. expected $36.15 billion) with a +0.8% beat - see Figure 1. However, Q2 2024 revenue guidance missed Wall Street expectations by only 1.3% and this is apparently the main reason for the price drop - see Figure 2. Importantly, Meta provides a revenue range as guidance for the next quarter. An additional reason cited in the media is higher CAPEX. Wall Street expected CAPEX in 2024 at $34.89 billion. CFO Outlook Commentary: “We anticipate our full-year 2024 capital expenditures will be in the range of $35-40 billion, increased from our prior range of $30-37 billion as we continue to accelerate our infrastructure investments to support our artificial intelligence (AI) roadmap. While we are not providing guidance for years beyond 2024, we expect capital expenditures will continue to increase next year as we invest aggressively to support our ambitious AI research and product development efforts.” All in all, my gut feeling is that we are just in the middle of a mean-reverting stock market correction – so Meta has just joined the harder falling stocks because it had previously grown significantly. Missed guidance or higher CAPEX was just a trigger and/or an excuse.


Meta Q3 2024 Review


3-Nov-2024. Meta Q3 Earnings Review. Meta reported quite solid results, however all that has been already priced in as the stock price have increased by 24.6% since the previous earnings release (S&P500 +5.3% over the same period). My key takeaways: 1) Meta beat revenue growth expectations in Q3 2024 on almost all lines (except Reality Labs, which is not significant because it only accounts for 0.7% of total revenue). Total Revenue grew by 18.9% YoY in Q3 – see Figure 1. 2) Meta has no intention of slowing down in Q4 2024 – it has given a revenue growth guidance for Q4 above Wall Street expectations. In Q4, Meta expects revenue in the range of $45-48 billion, and looking at the history of beating its own forecasts (Figure 2), the upper range of the forecast ($48 billion) means YoY growth of as much as 19.7%! This is impressive for a company of this size... 3) Meta intends to continue to invest aggressively, Susan Li, CFO: “We anticipate our full year 2024 capital expenditures will be in the range of $38-40 billion, updated from our prior range of $37-40 billion. We continue to expect significant capital expenditures growth in 2025. Given this, along with the back-end weighted nature of our 2024 capex, we expect a significant acceleration in infrastructure expense growth next year as we recognize higher growth in depreciation and operating expenses of our expanded infrastructure fleet”. Mark Zuckerberg on Meta’s AI models: “The Llama 3 models have been something of an inflection point in the industry, but I'm even more excited about Llama 4, which is now well into its development. We're training the Llama 4 models on a cluster that is bigger than 100k H100s or bigger than anything that I've seen reported for what others are doing. I expect that the smaller Llama 4 models will be ready first, and they’ll be ready, we expect sometime early next year, and I think that they're going to be a big deal on several fronts -- new modalities, capabilities, stronger reasoning, and much faster”. All in all: solid results, solid growth outlook, increased CAPEX and wide AI adoption and ongoing intense AI-related investments. Figure 3 shows Advertising segment revenues. Figure 4 shows Other Revenue segment revenues. Figure 5 shows Family of Apps segment revenues (Advertising + Other Revenue). Total Revenue: Family of Apps + Reality Labs (Figure 1). Figure 6 shows Reality Labs segment revenues. Figure 7 shows Reality Labs segment revenues and operating loss. Figure 8 shows how much of the operating profit (of the Family of Apps segment) is the operating loss of the Reality Labs.


Meta Q4 2024 Review

2-Feb-2025. Meta’s strong earnings! Meta showed strong Q4 2024 results – with Q4 revenue of $48.4B beating the Street by 3.2% - see Figure 1. It was also above Meta’s previous quarter guidance ($45-48B) – see Figure 2. Nevertheless, the company’s Q1 guidance was below market expectations (mid-range of only $40.65B vs. Street expectations of $41.7B). Meta is an example of rapid adoption of AI tools (Meta AI)… currently there are around 500m MAU (monthly active users) of Meta AI, but there is also a strong growth from the advertisers side: Susan Li, CFO: “Advantage+ creative is another area where we’re seeing momentum. More than 4 million advertisers are now using at least one of our generative AI ad creative tools, up from one million six months ago.” But within the company's business model, AI solutions will be monetized only once a large scale is built. China's DeepSeek doesn't seem to be a problem for the company either, quite the opposite: Mark Zuckerberg: “I can start on the DeepSeek question. I think there’s a number of novel things that they did that I think we’re still digesting. And there are a number of things that they have advances that we will hope to implement in our systems. And that’s part of the nature of how this works, whether it’s a Chinese competitor or not. (…) And that’s sort of how the technology industry goes. I don’t know -- it’s probably too early to really have a strong opinion on what this means for the trajectory around infrastructure and CapEx and things like that. There are a bunch of trends that are happening here all at once. There’s already sort of a debate around how much of the compute infrastructure that we’re using is going to go towards pretraining versus as you get more of these reasoning time models or reasoning models where you get more of the intelligence by putting more of the compute into inference, whether just it will mix shift how we use our compute infrastructure towards that.” After the DeepSeek events … Meta does not intend to reduce capital expenditures. CAPEX in 2025 will remain at the previously (before the DeepSeek revelations) announced level of $60-65B – a significant increase from 2024 – see Figure 3 and 4. More from Mark Zuckerberg on CAPEX and DeepSeek: “The field continues to move quickly. There’s a lot to learn from releases from basically everyone who does something interesting, not just the ones over the last month. We’ll continue to kind of incorporate that into what we do as well as making novel contributions to the field ourselves. And I continue to think that investing very heavily in CapEx and infra is going to be a strategic advantage over time. It’s possible that we’ll learn otherwise at some point, but I just think it’s way too early to call that. And at this point, I would bet that the ability to build out that kind of infrastructure is going to be a major advantage for both the quality of the service and being able to serve the scale that we want to”.


Meta: Winning in style!

14-Feb-2025. Meta – winning in style! Not only did Meta reach another all-time high ($729 intraday and $728.56 close), but it also set another record: 19th consecutive positive day.. the longest winning streak of any Nasdaq stock ever... – see Table 1. But that's not the end of the records.. if we look at the rate of return in the periods between the publication of results, Meta had only 1 quarter worse than S&P500... after the publication of Q1 2024 results (counting from Q4 2022 results – see Table 2). From 1-Feb-2023 to 13-Feb-2025, the cumulative outperformance against S&P500 is 327%. Figure 1 shows the relative performance of Meta in the periods between the publication of subsequent quarterly results.


20-day Winning Streak!

15-Feb-2025. 20-day winning streak & +21% up! Meta can't have a single down day! After yesterday's close, it's already the 20th positive day in a row! See Table 1. The information that Meta intends to invest in AI-powered humanoid robots was enough to score another positive day! This initiative will be under a new team formed within Meta's Reality Labs business segment. After the publication of Q4 2024 results, only Meta and Apple beat the S&P500 out of Mag7 companies - see Table 2 and Figure 1. Nvidia will not publish its results until February 26 this year.


Microsoft Q2 2023 review

26-Jul-2023. Microsoft showed solid Q2 results beating expectations on virtually every major data item. However, this is not enough considering the price, which is about 3-4% down (in after-hours market). Revenue growth is declining slightly, on a 12-month basis (TTM) the increase is +6.9% YoY (chart), and comparing quarter to quarter YoY +8.3% (chart). Azur which is the main growth engine (cloud platform) is growing 27% YoY (but down from 31% excluding currency fluctuations) and according to the company guidelines it will be between 25%-26% in the next quarter (chart). As part of Azur .. AI services is currently "only" 1 percentage point of the growth. AI .. the future growth engine is just future when it comes to concrete revenues, CFO Amy Hood: “Even with strong demand and a leadership position, growth from our AI services will be gradual as Azure AI scales and our copilots reach general availability dates. So, for FY24, the impact will be weighted towards H2.” However AI is the future, as CEO Satya Nadella said: "Every customer I speak with is asking not only how, but how fast, they can apply next generation AI". Interestingly, the "Azure OpenAI" service acquires almost 100 customers a day, Satya Nadella: "We have great momentum across Azure OpenAI Service. More than 11,000 organizations across industries, including Ikea, Volvo Group, Zurich Insurance (…) use the service. That’s nearly 100 new customers added every day this quarter.”


Microsoft Q3 2023 review

25-Oct-2023. Microsoft. Q1 2024 Earnings (short) review (it's Q3 2023 on calendar basis). Microsoft beat expectations at every revenue level. Total revenues amounted to $56.52 billion (+3.63% sales surprise, Chart 1). Microsoft divides revenues into 3 segments: 1) Productivity and Business Processes (e.g. Office and LinkedIn are here) $18.59 billion (+1.64% sales surprise), Chart 2, 2) Intelligent Cloud (e.g. Azur, Server Products) $24.26 billion (+2.75% sales surprise), Chart 3, 3) More Personal Computing (e.g. Windows, Gaming, Search) $13.67 billion (+6.05% sales surprise), Chart 4. Of course, the most important segment for the markets today is the Intelligent Cloud, which can be compared to Alphabet’s Google Cloud. Comparison: Microsoft: Intelligent Cloud Revenue $24.3 billion, beat +2.75%, YoY +19.4% and YoY +$3.92 billion, Alphabet: Google Cloud Revenue $8.4 billion, miss -2.21%, YoY +22.5% and YoY +$1.54 billion. Microsoft also beat expectations at the EPS level, which amounted to $2.99 per diluted share (+12.83% EPS surprise).


Microsoft Q1 2024 review

30-Apr-2024. Microsoft Q3 2024 Earnings review (it's Q1 2024 on calendar basis) My key takeaways: Microsoft beat expectations at every revenue segment. So it’s solid growth and one can assume that could continue in following quarters. Azur (Microsoft’s cloud infrastructure platform) is key, and it’s doing extremely well. CAPEX is booming and it’s AI related. Re 1) Total revenues amounted to $61.86 billion (+1.59% sales beat, Figure 1). Microsoft divides revenues into 3 segments: First, Productivity and Business Processes (e.g. Office and LinkedIn are here) $19.57 billion (slight beat, but practically in line with expectations), Figure 2, Second, Intelligent Cloud (e.g. Azur, Server Products) $26.71 billion (+1.75% sales beat), Figure 3, Third, More Personal Computing (e.g. Windows, Gaming, Search) $15.58 billion (+3.38% sales beat), Figure 4. Amy Hood, CFO, on "More Personal Computing" segment: “Revenue was $15.6 billion, increasing 17%, with 15 points of net impact from the Activision acquisition. Results were above expectations driven by better-than-expected performance in Gaming and Windows OEM”. Re 2) Intelligent Cloud segment can be compared to Alphabet’s Google Cloud and Amazon’s AWS – see Figure 5. Recently generative AI has kicked off the next wave of cloud expansion. About 70% of Intelligent Could Division's revenues come from Azur, Microsoft's cloud infrastructure platform. Azur is doing extremely well and is growing 31% YoY, which is very positive for investors - as many as 7 percentage points of this growth are due to AI Services: Satya Nadella, CEO: “Our AI innovation continues to build on our strategic partnership with OpenAI. More than 65% of the Fortune 500 now use Azure OpenAI Service”. “Azure has become a port of call for pretty much anybody who is doing any AI project.” Amy Hood: “Azure and other cloud services revenue grew 31%, ahead of expectations, while our AI services contributed 7 points of growth as expected” And on the Azur’s outlook: “In Azure, we expect Q4 revenue growth to be 30% to 31% in constant currency, or similar to our stronger-than-expected Q3 result. Growth will be driven by our Azure consumption business and continued contribution from AI with some impact from the AI capacity availability” “ (…) we do have demand that exceeds our supply by a bit. It is fair to say that that could have been an impact on the number for the quarter and does impact a little bit the number in Q4.” Re 3) Capex is accelerating. But the management feels good about it. Amy Hood: “We expect capital expenditures to increase materially on a sequential basis driven by cloud and AI infrastructure investments. As a reminder, there can be normal quarterly spend variability in the timing of our cloud infrastructure buildout and the timing of finance leases. We continue to bring capacity online as we scale our AI investments with growing demand. Currently, near-term AI demand is a bit higher than our available capacity.“ “To scale to meet the growing demand signal for our cloud and AI products, we expect FY25 capital expenditures to be higher than FY24. These expenditures over the course of the next year are dependent on demand signals and adoption of our services, so we will manage that signal thru the year.”


Microsoft Q2 2024 review
9-Aug-2024. Microsoft Q2 2024 (calendar) earnings review. My key takeaways: 1) Total revenue increased in Q2 2024 (Q4 2024 on fiscal basis) by 15.2% YoY to $64.73 billion (slightly beating expectations of $64.52 billion). The average YoY growth for the last 6 years is 14.48%. Overall, it is “a growth company”... with a company of this size, it is not that easy to increase revenues from $30 billion per quarter to $65 billion per quarter in 6 years. See Figure 1. 2) Microsoft divides revenues into 3 segments: - First, Productivity and Business Processes (e.g. Office and LinkedIn are here) $20.23 billion (+0.54% beat, +11.1% YoY - Figure 2), - Second, Intelligent Cloud (e.g. Azur, Server Products) $28.52 billion (-0.75% sales miss, +18.8% YoY - Figure 3, - Third, More Personal Computing (e.g. Windows, Gaming, Search) $15.90 billion (+2.32% sales beat, +14.3% YoY - Figure 4). 3) Azur is still a big success story. Revenues grew +29% YoY (GAAP) and +30% (constant currency, in line with expectations). Figure 5. "Azur and other cloud services" is part of the Intelligent Cloud segment, which, compared to the competition, is both the largest and the fastest growing (on a $ basis) - see Figure 6. 4) (AI-related) Capex is still growing at a rate of approximately 80% YoY, in Q2 2024 (Q4 2024 fiscal) it amounted to $19.0 bln. See Figure 7. 5) Solid outlook, see Table 1. SATYA NADELLA, CEO, on Azur: “We expanded our datacenter footprint, announcing investments across four continents. These are long term assets around the world to drive growth for the next decade and beyond. We added new AI accelerators from AMD and NVIDIA, as well as our own first party silicon Azure Maia. (…) We continued to see sustained revenue growth from migrations. Azure Arc is helping customers in every industry, from ABB and Cathay Pacific, to LALIGA, to streamline their cloud migrations. We now have 36,000 Arc customers, up 90% year-over-year. We remain the hyperscale cloud of choice for SAP and Oracle workloads. (…) With Azure AI, we are building out the app server for the AI wave, providing access to the most diverse selection of models to meet customers’ unique cost, latency, and design considerations. All-up, we now have over 60,000 Azure AI customers, up nearly 60% year-over-year, and average spend per customer continues to grow. Azure OpenAI Service provides access to best-in-class frontier models, including as of this quarter GPT-4o and GPT-4o mini. With Phi-3, we offer a family of powerful, small language models, which are being used by companies like BlackRock, Emirates, Epic, ITC, Navy Federal Credit Union, and others. And with Models as a Service, we provide API access to third party models, including as of last week the latest from Cohere, Meta, and Mistral. The number of paid Models as a Service customers more than doubled quarter-over-quarter (…)”. AMY HOOD, CFO on Azur and AI services demand: “Azure and other cloud services revenue grew 29% and 30% in constant currency, in line with expectations and consistent with Q3 when adjusting for leap year. Azure growth included 8 points from AI services where demand remained higher than our available capacity. In June, we saw slightly lower-than-expected growth in a few European geos”. AMY HOOD on CAPEX: “Capital expenditures including finance leases were $19 billion, in line with expectations, and cash paid for P, P, and E was $13.9 billion. Cloud and AI related spend represents nearly all of total capital expenditures. Within that, roughly half is for infrastructure needs where we continue to build and lease datacenters that will support monetization over the next 15 years and beyond. The remaining cloud and AI related spend is primarily for servers, both CPUs and GPUs, to serve customers based on demand signals. For the full fiscal year, the mix of our cloud and AI related spend was similar to Q4”. AMY HOOD on CAPEX outlook: “To meet the growing demand signal for our AI and cloud products, we will scale our infrastructure investments with FY25 capital expenditures expected to be higher than FY24. As a reminder, these expenditures are dependent on demand signals and adoption of our services that will be managed thru the year”.


Microsoft Q3 2024 Review


17-Nov-2024. Microsoft Update Since the last all-time high in early July, Microsoft has been down 11.2%, and since the publication of the results for the calendar quarter Q3 2024 (Q1 2025 based on the company's reporting), the price has fallen 4.05% in absolute terms (i.e. -5.03% relative to the S&P500). See Figure 1. Year-to-date (YTD), the price is up only 10.4% (with the S&P500 +23.1%). Nevertheless, after a very good 2023, the Microsoft price counting from 29-Dec-2022 is still well above the S&P500 (+73.0% vs. 52.9%). Even if Microsoft's results did not impress investors, as in the last 4 quarters - the underperformance relative to the S&P500 was not significant (see Figure 2). The Q3 2024 results (quarter ending 30-Sep-2024) were solid, but not enough to impress investors. Microsoft fell 6.1% on the first day after the results were announced. Total revenue amounted to $65.6 billion and beat expectations by 1.67%. Figure 3. Investors could be concerned about the declining revenue growth of Azur. The growth in Q3 2024 was 34% (constant currency), while the company forecasts a decline to 31.5% in Q4 2024. See Figure 4. Figure 5 is a comment by AMY HOOD, CFO. CAPEX amounted to $20 billion and will increase in the next quarter... see Figure 6. Already growing YoY almost 80%! Amy Hood: "We expect capital expenditures to increase on a sequential basis given our cloud and AI demand signals. As I said last quarter, we will stay aligned, and if needed adjust, to the demand signals we see. As a reminder, there can be quarterly spend variability from cloud infrastructure buildouts and the timing of delivery of finance leases”. ---- Figure 7 shows the revenue breakdown by business segments, and Figure 8 shows the revenue breakdown by Products and Services.


Microsoft Q4 2024 Review

2-Feb-2024. Microsoft disappointed - a little bit. Although Microsoft once again beat expectations for total revenue ($69.63B vs EST. $68.92B – see Figure 1), yet the most important thing for the market was the growth in Azur cloud revenue – which once again disappointed a little. In Q2/Dec 2025, Azure revenue grew only 31% (vs. expected 31.8%). Additionally, Microsoft’s guidance for Q3/Mar 2025 was olny 31.5% (mid point of 31-32% range) vs. the Street expectation of 33-34%. Previously, Microsoft had talked about accelerating Azure growth in 2H 2025FY – i.e. in 1H 2025CY. See Figure 2. According to the company’s commentary, the lower than expected growth is related to sales execution. This disappointment caused the share price to fall by about 6% since the print. Capex was $22.6B in Q2/Dec – see Figure 3. Microsoft expects a slower rate of Capex growth in 2026FY. Amy Hood, CFO: “We expect quarterly spend in Q3 and Q4 to remain at similar levels as our Q2 spend. In FY26, we expect to continue investing against strong demand signals including customer contracted backlog we need to deliver against across the entirety of our Microsoft Cloud. However, the growth rate will be lower than FY25 and the mix of spend will begin to shift back to short-lived assets which are more correlated to revenue growth.” Interestingly, China’s DeepSeek is good news… as per Satya Nadella’s comment: “I think DeepSeek has some real innovations. (…) now that all gets commoditized, and it’s going to get broadly used. And the big beneficiaries of any software cycle like that is the customers, because at the end of the day, if you think about it, what was the big lesson learned from client server to cloud? More people bought servers, except it was called cloud. And so, when token prices fall, inference computing prices fall, that means people can consume more. And there will be more apps written. And it’s interesting to see that when I referenced these models that are pretty powerful, it’s unimaginable to think that here we are in the beginning of ‘25, where on the PC, you can run a model that required pretty massive cloud infrastructure. That type of optimizations means AI will be much more ubiquitous. And so, therefore, for a hyperscaler like us, a PC platform provider like us, this is all good news as far as I’m concerned.”


Novo Nordisk vs Mag7

13-Sep-2023. Big is good. Not only large American tech companies can grow quickly and generate exceptional returns for investors. Recently, Novo Nordisk from Denmark has become the largest European company by market capitalization (overtaking LVMH from France). But Novo Nordisk's current capitalization is approximately USD 444 billion, which is still much less than each of the Mag7 companies (see the chart). The smallest is Meta with a capitalization of USD 667 billion. Apple recently from its high lost USD 335 billion in capitalization (but is still worth USD 2.75 trl). YTD returns for Mag7 band range from +36% (Apple) to +207% (Nvidia). Novo Nordisk is +45% YTD as of yesterday – see the chart. “Fun fact”: Like Nvidia, Novo Nordisk also has its own rapidly growing revenue segment (that’s why it’s the largest EU company): "Obecity Care", specifically the drug "Wegovy". In the case of Nvidia, it is about the "Data Center" - i.e. revenues related to AI. Wegovy's sales revenues grow by over 530% YoY (see chart) to DKK 7.5 billion in Q2 2023 (USD 1.08 billion). Nvidia Data Center revenues grow over 170% YoY (chart). Of course, in the case of Novo Nordisk, Wegovy sales revenues are "currently only" 13.9% of total revenues, and the entire Obecity Care segment is just 19% - see chart. Large companies are good. S&P500 is only +16.2% YTD.
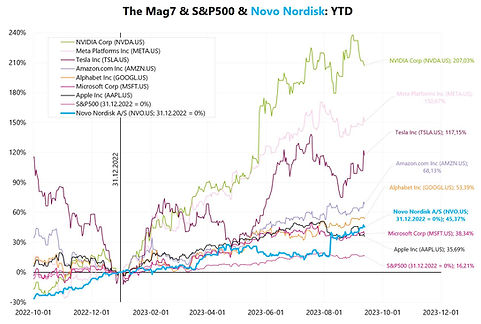
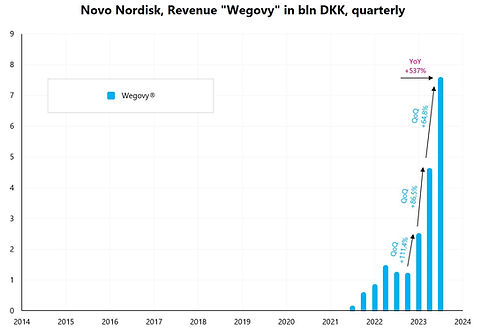
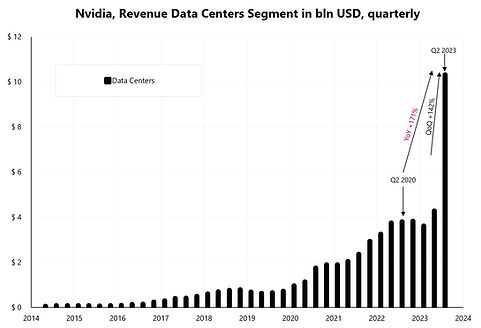
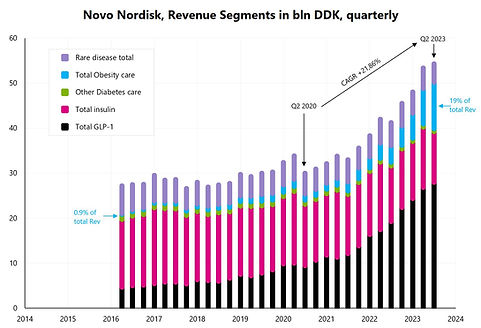
Novo Nordisk Q3 2023 review

2-Nov-2023. Novo Nordisk. The largest EU company by market-cap. Short Q3 earnings review. Novo Nordisk shares have already increased by 48.4% this year - which is as much as the largest US companies - see chart 1. Today, Novo Nordisk published its results for Q3 2023, slightly beating Wall Street estimates. However, two weeks ago (13-Oct), Novo Nordisk raised its earnings forecast for 2023 (e.g. raised its revenue forecast to 32-38% growth in 2023 from the previous forecast of 27-33%), so analysts had an easier time forecasting results. Revenues in Q3 increased 28.9% YoY in DKK to DKK 58.7 trillion - see chart 2. Two factors are responsible for the increase in sales: 1) the world-famous anti-obesity drug Wegovy: +734% YoY (+ DKK 8.5 trillion) – see chart 3 2) and the diabetes drug Ozempic, which accounts for as much as 78% of sales of the GLP1 (glucagon-like peptide-1 drugs) segment - see chart 4. The demand for Wegovy is so high that the company's main challenge now is to keep up with production! Well, sort of luxury problem…


3-Nov-2023. Novo Nordisk. Q3 earnings review. Part 2. The Novo Nordisk share price has increased by 196.2% since December 31, 2020. At the same time: 1) S&P500 is +14.95% 2) NYSE ARCA Pharmaceutical Index +26.41%. See chart 1 3) Nvidia +233.9% 4) Apple +35.4% But, for example, the rate of returns from 31-Dec-2019 look like this: 1) Novo Nordisk +263.0% 2) S&P500 is +33.6% 3) NYSE ARCA Pharmaceutical Index +33.3% 4) Nvidia +642.1% 5) Apple +146.9% Chart 2 shows the relative (vs. NYSE ARCA Pharmaceutical Index) behavior of the Novo Nordisk share price after the publication of results for the last 4 quarters.

Novo Nordisk's Wegovy Q4
20-Feb-2024. Novo Nordisk's Wegovy blockbuster. My key takeaways form recent earnings and market developments (part 1): 1) This is a comfortable situation for the company when the demand for anti-obesity drugs is growing rapidly and the main challenge is to increase production capacity. The main drug in this area is Wegovy, approved by the FDA in 2021. Wegovy's full-year 2023 sales increased by 407% (from DKK 6.2 billion in 2022 to DKK 31.3 billion in 2023) - see Figure 1, which shows Wegovy's quarterly revenues and Wall Street consensus estimate for 2024-2025, 2) Competition from Eli Lilly in the obesity drug space is only helping to excite investors about the prospects of the anti-obesity drug market. The share prices of Novo Nordisk and Eli Lilly are moving together, significantly outperforming the S&P500 as well as the NYSE ARCA Pharmaceutical Index - see Figure 2 3) Eli Lilly's Zepbound got the FDA's approval on November 8, 2023, and was available for sale from December 5 - and in December 2023 alone, sales amounted to $175 million. When publishing its results on February 6, 2024, the company boasted about the success of Zepbound - Figure 3. 4) In the case of Zepbound, Wall Street forecasts strong sales growth in the coming quarters – see Figure 4.


Novo Nordisk Q4 2023 review

27-Feb-2024. Novo Nordisk's Wegovy blockbuster (part 2) Novo Nordisk's revenues in Q4 2023 increased year-on-year by 37% (+DKK 17.8 billion) to DKK 65.863 billion. Figure 1. The largest share of sales is GLP-1, see Figure 2. The quarterly change in revenue was DKK +7.132 billion. The largest contribution is GLP-1 +DKK 7.126 billion (Figure 3). The two largest contributors to the annual change in revenues are Wegovy (+DKK 7.2 billion) and GLP-1 (+DKK 13.4 billion). These two items give an annual increase of +DKK 20.6 billion - which is more than the total increase in revenues (all other items decreased year-on-year). Wegovy and Saxenda medicines constitute the "Total Obecity Care" segment. Figure 4 shows the annual contribution to the revenue change. Key takeaway: the drastic increase in demand applies not only to drugs dedicated to obesity but also to drugs for diabetes (with the same active substance). Both in the case of Novo Nordisk (in the case of Ozempic and Wegovy, the active substance is semaglutide – Figure 5) and in the case of Eli Lilly (Mounjaro and Zepbound - the active substance is tirzepatide - Figure 6).


Novo Nordisk CMD'24 review

8-Mar-2024. + 9% up only today! Novo Nordisk's stock is up 9% today and so far... 31% up this year. Today there was the Capital Market Day for investors, during which Novo Nordisk presented 3 main takeaways regarding anti-obesity drugs: 1) Wegovy® has unlocked the obesity care market yet a large unmet need remains. NN (Novo Nordisk) achieved sales of anti-obesity drugs in the amount of DKK 42 billion in 2023 (Figure 1). But only 1 million patients out of 813 million take obesity medications today (Figure 2). And in 2030, this number will increase to 1,246 million people (adults) - Figure 3. 2) SELECT trial is a key differentiator with semaglutide 2.4 mg as the first and only AOM treatment with a proven CV benefit. AOM stands for anti-obesity medications, CV is cardiovascular. Semaglutide treats not only obesity but also other obesity-related comorbidities. CVs are particularly important, as they may allow for more refinancing of treatment by payers. The SELECT population represents ca. 10% of the total obesity population. See Figure 4 and 5. 3) Pipeline and supply capacity support continued NN leadership in obesity. NN presented its entire portfolio of anti-obesity drugs in development (Figure 6), but the most important for investors are the Phase 1 results for Amycretin - a once daily oral co-agonist - which causes weight loss by 13.1% after 12 weeks (Figure 7). Amycretin uses the same GLP-1 hormone as other weight-loss drugs, such as NN's Wegovy or Eli Lilly's Zepbound. The key here is the fact that it also stimulates the amylin hormone, which regulates hunger. 13% weight loss is twice as good as in the case of subcutaneous Wegovy!


Novo Nordisk Q1 2024 review

2-May-2024. Novo Nordisk Q1 2024 Earnings Review My key takeaways: 1) Total revenue beat +2.65%, Operating profit beat +10.4%, Net profit beat +10.0%, EPS diluted beat +8.75% 2) Revenues increased YoY by 22.5% - additionally, in the last two months analysts have significantly increased their revenue growth forecasts in the following years - see Figure 1 3) However, quarter-on-quarter revenues decreased by 0.78% - see Figure 2 (rev split by segments). Total GLP-1 revenues decreased the most quarter by quarter by DKK -2.78 billion - see Figure 3. Wegovy's sales have not been growing for 3 quarters either. The company has not been able to meet demand for practically a year: “Demand for Wegovy® exceeds supply, and to safeguard continuity of care, supply of the lower Wegovy® dose strengths in the US has been reduced since May 2023. Novo Nordisk started gradually increasing the supply of the lower strength doses in January 2024.” 4) Novo Nordisk is going to expand its production capacity to meet up the demand for weight-loss drugs. The company announced an agreement to acquire three fill-finish sites from Novo Holdings A/S, following Novo Holdings A/S's acquisition of Catalent. This acquisition is expected to be a significant boost to the company's manufacturing capabilities. 5) The company also slightly raised its financial outlook for the entire year 2024. Currently, the company expects sales to increase by 19-27% (it was 18-26% - outlook from January 31 this year). The increase in operating profit is expected to be between 22-30% throughout 2024 (was 21-29%) 6) But year on year, the company achieved a significant increase in revenues of key drugs: Ozempic +41.6% (DKK +8.17 bln) Wegovy +105.5% (DKK +4.81 bln) Ozempic + Wegovy YoY = DKK +12.98 bln Total GLP-1 (here is Ozempic) +30.5% (DKK +8.17 bln) Total Obesity (here is Wegovy) +40.7% (DKK +3.19 bln) Total Sales +22.5% (DKK +11.98 bln) Figure 4 details the YoY change in DKK billion.


Novo Nordisk consensus

9-May-2024. Novo Nordisk and Elli Lilly benefit from the sale of weight-loss drugs. Investors also benefit, only this year the prices of these producers increased 2-3 times more than S&P500 or NYSE ARCA Pharmaceutical Index - see Figure 1. The Novo Nordisk share price reacted a bit negatively to the earnings announced on May 2 this year (among others there was a miss on the Wegovy sales). It is therefore worth checking how Wall Street's expectations regarding revenue growth have changed after the publication of financial results (when analysts had time to "digest" all the new data). Figure 2 shows the change in the consensus for total revenues (we compare the consensus after the announced results for Q4 2023 (dated 19-Feb-2024), the consensus before the announcement of Q1 2024 results (19-Apr-2024) and the consensus after the announced results for Q1 2024 (8-May-2024). Figure 3 shows this data in a zoom-in version. All-in-all analysts increased their revenue growth expectations for the subsequent 4 quarters by 1.5% (highlighted in green, at the bottom of the chart). Figure 4 shows the consensus change for Wegovy: +5.4% higher revenues over the subsequent 4 quarters. That's quite positive! Figure 5 shows the change in the consensus for Ozempic: only +0.1% - but sales in Q1 beat expectations by as much as 4.24%. All in all, according to Wall Street, Novo Nordisk's revenues will grow faster than analysts expected before the results were published. The negative reaction of the stock price seems to be short-lived. Bonus Charts: Figure 6 and 7 show sales growth of Eli Lilly's competitive drugs (Zepbound and Mounjaro), including published results for Q1 2024.


Tesla Q2 2023 review
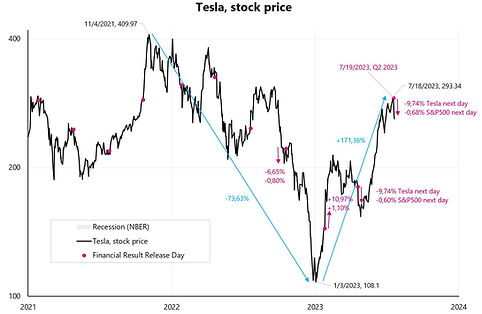
23-Jul-2023. This year, Tesla's share price is up more than 170%. However, after the publication of Q2 results (July 19, 2023), Tesla fell 9.7%, similarly after the publication of Q1 results (April 19), the decline was also 9.7%. One of the main reasons of negative market reaction (within the financial results) is the declining gross margin (sales revenue minus costs of products sold), which in Q1 2022 amounted to 29.1% - and now is only 18.2%. The main cause is the falling demand for cars and the rising cost of debt financing consumer purchases - which triggers Tesla to cut sales prices and worsen its sales mix. From March 2022, interest rate increases in the US began, which coincides perfectly with the falling gross margin. Elon Musk on price cuts: “So when interest rates rise dramatically, we actually have to reduce the price of the car because the interest payments increase the price of the car. And this is, at least up until recently, it was, I believe, the sharpest interest rate rise in history.” Zach Kirkhorn, CFO: “Variability around average selling prices goes back to Elon’s point. We don't control interest rates. We don't control macro consumer sentiment. But we have an obligation to be responsive to that to ensure that we're matching supply and demand and keeping things balanced. And so, this is how we're managing the next handful of quarters. Soon enough, these quarters will be behind us.” Tesla is a growth company (in Q2 TTM revenues increase YoY by 40%) and there is a rather small chance that it will "fall out" of the club of "The Magnificent Seven" (MSFT, AAPL, NVDA, TSLA, GOOGL, META, AMZN), but from the fundamental point of view, it is worth watching how Tesla will cope with falling margins and a difficult market environment for the automotive industry.


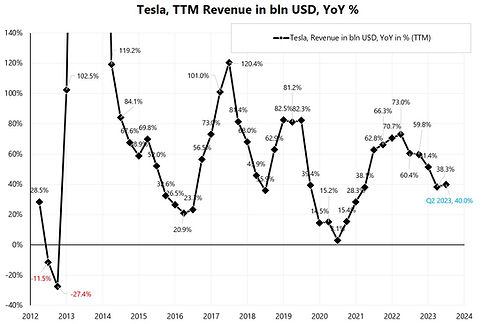
Tesla Q3 2023 preview

18-Oct-2023. Tesla. Q3 2023 results. Tesla will release Q3 2023 financial results today after the market close. The 3 previous releases in a row meant a price movement on the next day of 9-10% relative to the S&P500 (Chart 1). Tesla's stock behaved interestingly after the publication of the Q1 2023 results: the next day it fell 9%, and then during the quarter it increased by over 50% relative to the S&P500 (Chart 1). In the current quarter, after the publication of Q2 2023 results, Tesla's price performed the worst of all "Mag7" stocks (Chart 2). What will investors pay special attention to in Q3 2023 results: - price reductions for Model 3 and Model Y - delayed rollout of Cybertruck - pressure on margins and if the trough in the margin is possible this quarter - expected revenues: USD 24.2 billion, adjusted EPS: USD 0.74, adjusted net income: USD 2.56 billion.


Tesla Q3 2023 review

19-Oct-2023. Tesla. Q3 2023 results. Part 1. Key takeaways: 1) Formally, Tesla published results below expectations, missing on top-line, margins, bottom-line and deliveries: Revenues $23.35 billion (vs expected $24.06 billion) Gross margin 17.9% (vs 18.0% expected) Gross margin ex-regulatory credits 16.3% (vs 17.7% expected) Adjusted EPS $0.66 (vs $0.74 expected) Total deliveries (published a few days earlier) 435.1k in Q3 (vs 456.7k expected) 2) The high interest rate environment “is killing” demand, hence price cuts and falling margins. It is difficult to expect changes here until rates drop. Of course, Tesla reduces costs etc. to adapt to such a situation, 3) Sentiment towards the company may improve at the end of the year due to the launch of Cybertruck production in Texas. While the potential demand is huge (e.g. there are currently above 1 million people who have reserved the car), achieving high and profitable production will take many months and, in general, according to Elon Musk, it is a very big challenge.


19-Oct-2023. Tesla. Q3 2023 results. Part 2. Below are selected statements from the results conference. Elon Musk on Cybertruck: “It is going to require immense work to reach volume production and be cash flow positive at a price that people can afford (…) prototypes are easy, production is hard (…) But this difficulty going from a prototype to volume production is like 10,000% harder to get to volume production than to make the prototype in the first place. And then it is even harder than that to reach positive cash flow (…) I just want to temper expectations for Cybertruck (…) it will take, I don't know, a year to 18 months before it is a significant positive cash flow contributor (…) the demand is off the charts. We have over 1 million people who have reserved the car (…) we need to make it at a price that people can afford, insanely difficult things.” On Cybertruck yearly output: “I think we'll end up with roughly 0.25 million Cybertrucks a year, but we're not -- I don't think we're going to reach that output rate next year (…) I think we'll probably reach it sometime in 2025.” On complexity of Cybertruck: “(…) we dug our own grave with the Cybertruck. You know, nobody – in general, probably nobody digs a grave better than themselves. And so, it is -- Cybertruck's one of those special products that comes along only once in a long while. And special products that come along once in a long while are just incredibly difficult to bring to market to reach volume, to be prosperous. It's fundamental to the nature of the newness.” Elon Musk on high interest rates: “I am worried about the high interest rate environment that we're in. I just can't emphasize this enough, that the vast majority of people buying a car is about the monthly payment (…) If interest rates remain high or if they go even higher, it's that much harder for people to buy the car. They simply can't afford it (…). A lot of -- a large number of people are living paycheck to paycheck.” On whether Tesla can postpone building a new factory in Mexico due to weak economy/demand? „We're definitely making the factory in Mexico (…) The question is really just one of timing. And there's going to be a broken record on the interest front. It's just the interest rates have to come down. Like if interest rates keep rising, you just fundamentally reduce affordability. It is just the same as increasing the price of the car. So, I just don't have visibility into -- if you can tell me what the interest rates are, I can tell you when we should build the factory (…). But I am still somewhat scarred by 2009 when General Motors and Chrysler went bankrupt (…) So, I'm like -- I want to just -- I don't want to be going at top speed into uncertainty (…). If interest rates start coming down, we will accelerate.”
Tesla's reaction to Q3 2023

20-Oct-2023. Tesla. The second day after the Q3 2023 results. After two days: Tesla is down -12.65% S&P500 -2.10%. So Tesla relative to S&P500 is -10.55%.


19-Oct-2023. Tesla. The first day after the Q3 2023 result. Tesla is down -9.30% at market close. S&P500 is -0.85%. So Tesla relative to S&P500 is -8.45%. The chart shows how Tesla's price behaved relatively to the S&P500 after the earnings release for: Q4 2022, Q1 2023, Q2 2023 and Q3 2023.

26-Jan-2024. Tesla. Q4 2023 results. Part 1. My key takeaways: 1) Q4 2023 was below expectations, but not to such an extent as after the results for Q3 2023. Tesla sold more cars in Q4 2023 than the market expected (485k vs 473k), which it announced at the beginning of January. Still, revenues were lower than market expectations ($25.17 billion vs expected $25.87 billion, Figure 1) due to lower average selling prices. Tesla is constantly lowering the sales prices of its models, which is a way to increase sales while the demand for cars is weakening. 2) Therefore, due to the cuts in selling prices, margins were supposed to be the most important point for Wall Street. And here Tesla delivered more than the market expected, but not on every margin. The gross margin was below market expectations (17.6% vs. expected 18.1%), but perhaps the most important margin, automotive gross margin excluding regulatory credits, turned out to be well above expectations (17.2% vs. expected 15.0%, Figure 2). Mainly because that Tesla was able to reduce the cost of production per vehicle, Figure 3. 3) But it was the outlook for 2024 that did the most damage: "In 2024, our vehicle volume growth rate may be notably lower than the growth rate achieved in 2023, as our teams work on the launch of the next-generation vehicle at Gigafactory Texas." This means that in 2024, the growth will be weak, but it will be compensated by a stronger sales in 2025 (in H2 2025, a new car model from the lower segment will be launched with a target sales volume of up to 500,000 per year). 4) Therefore, in 2024, there remains the sale of existing models and the Cybertruck (which is unlikely to achieve large production volumes soon). Yesterday the share price in the cash market reacted even stronger than in the after-hours trade (down 12.13% vs 6-8% in the after-hours trade) and it is similar to the previous 3 quarters: After the results for Q1 2023, Tesla's price fell on the 1st day on the cash market by 9.75% (S&P500 -0.60%), After the results for Q2 2023, Tesla's price fell by 9.74% on the 1st day (S&P500 -0.68%), After the results for Q3 2023, Tesla's price fell by 9.30% on the 1st day (S&P500 -0.85%).


27-Jan-2024. Tesla Q4 2023 earnings review. Part 2. Figure 1 shows the current (so post analysts' revisions after the publication of Q4 2023 results) consensus revenues forecast for 2024-2025. Clearly, the world is not over for Tesla yet. On a YoY basis, revenues from Q3 2024 accelerate to approximately 20% YoY growth (quarter-on-quarter in Q2 2024 we have growth of +6.6% - then between 2.2% and 6.3% QoQ). If revenues are to grow by more than 20% (YoY) in Q3 2024, investors could try to front-run such growth in Q2…, ceteris paribus. Figure 2 shows how Tesla's price behaved relative to the S&P500 after the publication of the earnings (last 5 quarters). Max relative (to S&P500) drawdowns were: After Q1-2023: -12.5% After Q2-2023: -21.7% After Q3-2023: -15.3% After Q4-2023 to date: -12.3%. But to better assess the price behavior immediately after the publication of the results, one should also look at the price behavior in the previous quarter and immediately before the publication of the results (as can be seen in Figure 2, there are significant differences in this respect). Additionally, one also need to look at the size of beat/miss of the results and the size of “beat/miss” of the company's outlook/guidance. --- Elon Musk during the results conference about the margin and demand for Tesla cars: "If the interest rates come down quickly, I think margins will be good. And if they don't come down quickly, they won't be that good, yeah. It's always important to remember that the vast majority of people buying a car is about the monthly payment. It's not that people don't want -- we have tons of -- we have lots of people who want to buy our car but simply cannot afford it. (…) It's straightforward pretty. And there are no tricks around -- to get around this.” And about Cybertruck: “It's important to emphasize that this is very much a production-constrained situation, not a demand-constrained situation. And we you know, obviously, like, we could dramatically raise the price, but that -- that doesn't feel right to us to sort of, you know, gouge people for, you know, for early delivery, so. But really, the demand is off the hook. As long, as long as the price is affordable, I mean, I see us ultimately delivering on the order of a quarter million -- something like a quarter million Cybertrucks a year in North America, but maybe more, give or take, you know, roughly on that -- on that time frame.” The consensus expects Cybertruck production to reach 112k annual run-rate in Q4 2024 and 155k annual run-rate in Q4 2025.


23-Apr-2024. Tesla Q1 2024 Earnings Preview Wall Street expects Q1 2024 revenue at $22.3 billion, representing a YoY decline of 4.4%, and sequentially (against Q4 2023) of 11.4%. Since the publication of the results for Q4 2023, analysts have significantly lowered their forecasts for Tesla - Figure 1, and the share price has fallen by over 30% since then (Figure 2). At the beginning of April, we also got data on deliveries and production in Q1 2024 – see Figure 3. Deliveries dropped by 20% QoQ (but there were several one-off events). Tesla's main problem: high interest rates that reduce demand (cars are usually bought on credit) and relatively high prices of EV cars (even less demand). What to pay special attention to in the Q1 2024 earnings: 1) Mainly EV demand and margins (price cuts), but also 2) Future growth driver like robotaxis 3) Full Self Driving (and recognition of deferred revenues) 4) Cybertruck demand, production etc. 5) And other things like Elon's compensation, workforce reductions, gigafactory expansion, mass-market vehicle.


25-Apr-2024. Tesla Q1 2024 earnings review My key takeaways: 1) Q1 2024 was a terrible quarter, with revenues down 15.4% QoQ and 8.7% YoY. Mainly due to a drop in ASP (vehicle average selling price), but partly due to one-off events (like Giga Berlin production disruptions). Tesla showed negative free cash flow in Q1, mainly due to higher car production and lower deliveries, but also higher CAPEX. Q2 2024 should be much better. 2) To improve the situation, Tesla cut employment by 10% (The savings generated are expected to be well in excess of $1 billion on an annual run rate basis), and accelerates the introduction of a new cheap car model. It seems that the faster introduction of the new cheap model "saved" the company's share price. At least for a while. Elon Musk during earnings call: “We've updated our future vehicle lineup to accelerate the launch of new models ahead, previously mentioned start of production in the second half of 2025. So, we expect it to be more like the early 2025, if not late this year.” 3) Great emphasis during the earnings call is placed on the future fully autonomous version of FSD (full self-driving). This will "unlock" the true value of the company. But we don't know how long it will take. This could still be years away. Some analysts talk about the 2030s. But Tesla is well on its way to achieving this, and the latest FSD Version 12 is fully AI-based. Elon Musk: “I think Cathie Wood said it best. Like really, we should be thought of as an AI or robotics company. If you value Tesla as just like an auto company, you just have to -- fundamentally, it's just the wrong framework (…). So, I mean, if somebody doesn't believe Tesla is going to solve autonomy, I think they should not be an investor in the company.” “(…) the way to think of Tesla is almost entirely in terms of solving autonomy and being able to turn on that autonomy for a gigantic fleet. And I think it might be the biggest asset value appreciation history when that day happens when you can do unsupervised full self-driving.” 4) All in all, is all the worst already priced in the price? Doubtful, car demand will not rebound significantly until interest rates fall. But at least Tesla's post-earnings rebound of some 12% gives some hope. Yet the real test will be to defend the stock price level before the results were announced, i.e. USD 140-145 range. Figure 1 shows the revenues $bln and YoY%. Figure 2 shows Tesla’s margins. Figure 3 shows Tesla’s avergae cost of vehicle. Figure 4-6 show Tesla’s revenue segments (Automotive, Energy Generation & Storage, Services & Other).


23-Jul-2024. Tesla Q2 2024 preview. Wall Street expects revenues of $24.11 billion in Q2 2024. This is a YoY decline of 3.3%, but an increase compared to Q1 2024 of 13.2%. On July 2, 2024, Tesla released data on the number of deliveries in Q2 2024, which it publishes at the beginning of each quarter. Thus, in Q2 the total number of cars delivered (Total Deliveries) amounted to 444 thousand (the market expected 438 thousand – see Figure 1). This was 1.4% better than the consensus, 14.8% better than the number of cars delivered in Q1 2024, but 4.8% worse than Q2 2023. Figure 2 shows the change in Wall Street expectations regarding projected revenues. In July 2024, Wall Street's forecast remained virtually unchanged (from July 4 to July 22). However, after good data on deliveries, the consensus regarding EPS began to grow - see Figure 3. The EPS (adjusted) estimate for Q2 is currently $ 0.61 (on July 1 it was $ 0.57). Fugure 4 shows quarter-by-quarter EPS estimate change from 2021 onwards. Figure 5 further shows the actual reported EPS. Tesla will release results after the market close on July 23, 2024.


27-Jul-2024. Tesla Q2 2024 earnings review. Tesla is a combination of a traditional car manufacturer and a technology company. Hence the high valuation compared to "only traditional" car manufacturers. Technology is autonomy. Elon Musk: “As I said this before in earning calls, it -- the value of Tesla overwhelmingly is autonomy. These other things are, I think, no way it's relative to autonomy. So I recommend anyone who doesn't believe that Tesla would sell vehicle autonomy should not hold Tesla stuff. They should sell their Tesla stuff. If you believe Tesla will sell autonomy, you should buy Tesla stuff. And all these other questions are in the noise”. However, this time investors focused more on traditional things and less on future technology - hence the negative reaction to the Q2 2024 results. Key takeaways: 1)Tesla beats Revenue Consensus: Q2 Revenue $25.5bln, up 2% YoY, and beating estimates of $24.63bln – see Figure 1, 2)But EPS and margins below expectations turned out to be crucial for the market's reaction to the results, 3)Q2 adjusted EPS 52c, down 43% YoY, and missing estimates of 61c – this is the fourth quarter in a row below expectations - see Figure 2, 4)Regulatory credits save the day... in the amount of $890 million, which means a YoY increase of 218% - see Figure 3, 5) As a result, the "Automative Gross Margin ex-regulatory Credits" margin dropped significantly. Currently, it is only 14.6% (it was 30.5% in Q3 2021 - see Figure 4), 6) Tesla is doing very well in other business segments: while Total Automative Revenues decreased year-on-year by 6.54% (Figure 5), Energy Generation revenues increased year-on-year by 100% (Figure 6), and Total revenues Services +21% (Figure 7), 7) In the long term, the most important are: autonomy and robotaxi, cheaper Tesla models, artificial intelligence software and hardware. Elon Musk on autonomy and robotaxi: “Regarding full self-driving and Robotaxi, we've made a lot of progress with full self-driving in Q2. And with version 12.5 beginning rollout, we think customers will experience a step change improvement in how well supervised full self-driving works. Version 12.5 has five times the parameters of 12.4 and finally merged the highway and city stacks. So the highway stack at this point is pretty old. So often the issues people encounter are on the highway. But with 12.5, we finally merged the two stacks”. About Optimus robots: “we expect to have several thousand Optimus robots produced and doing useful things by the end of next year in the Tesla factories. And then in 2026, ramping up production quite a bit. And at that point, we'll be providing Optimus robots to outside customers. That will be a production Version 2 of Optimus”. On energy business: “This is growing faster than anything else. This is -- we are really demand constrained rather than production constrained.” On when to expect the first robotaxi ride: “(…) my predictions on this have been overly optimistic in the past. So I mean, based on the current trend, it seems as though we should get miles between interventions to be high enough that -- to be far enough in excess of humans that you could do unsupervised possibly by the end of this year. I would be shocked if we cannot do it next year”. About Nvidia chips: “I'm incredibly impressed by NVIDIA's execution and the capability of their hardware. And what we are seeing is that the demand for NVIDIA hardware is so high that it's often difficult to get the GPUs. And there just seems this -- I guess I'm quite concerned about actually being able to get steady out NVIDIA GPUs and when we want them”.


24-Oct-2024. Tesla Q3 Earnings Review. Tesla is up 12% in after hours trading. My key takeaways: 1) Strong growth in profitability, in particular Gross Margin ex-regulatory Credit, which increased to 17.1% in Q3 - see Figure 1… against Wall Street expectations of 14.9%. Elon Musk: “In fact, I think if you look at, EV companies, worldwide to the best of my knowledge, no EV companies even profitable. And I'm not I to the best of my knowledge, there was no EV division of any company, of any existing auto company that is profitable”. 2) Strong outlook for Q4 2024 Total Deliveries. Tesla reported 463k total deliveries in Q3, but also mentioned that “Despite ongoing macroeconomic conditions, we expect to achieve slight growth in vehicle deliveries in 2024.” So far in 2024 Total Deliveries are 1,294k (Q1 to Q3). In 2023 Total Deliveries were 1,806k – so implied Total Deliveries in Q4 would be at least 515k – which would be new all-time-high – see Figure 2. And what about the 2025? Elon Musk: “So, regarding the vehicle business, we are still on-track to deliver more affordable models starting in the first half of 2025. This is I think probably people are wondering what they should assume for vehicle sales growth next year. And at the risk of taking a bit of risk here, I do want to give some rough estimate, which is I think it's 20% to 30% vehicle growth next year.” 3) If the outlook works out and Tesla returns to automotive sales growth, investors are not particularly bothered by the miss on Q3 2024 revenues. Q3 Revenues came in at $25.18 billion, compared to Wall Street’s expectations of $25.43 billion – see Figure 3. Elon Musk: “So in conclusion, Tesla is focused on building the future of energy, transport, robotics, and AI. And this is a time when others are just focused on managing around near term trends. We think what we're doing is the right approach. And, if we execute on our objectives, then I think we will. Tesla my prediction is Tesla will become the most valuable company in the world and probably by a long by a long shot.”


25-Oct-2024. Tesla +21.9% after strong earnings! Tesla closed the day +22% adding about $164 billion in market cap! If we look at the last 7 earnings reports, this type of price movement is not uncommon. The relative price change to the S&P500 in the quarter following the earnings announcement ranges from +70% to -35% - see Figure 1.


1-Feb-2025. Tesla – a self-driving wolf? Elon Musk on the earnings call: “I know people have said, "Well, Elon, the boy who cried like a wolf like several times." But I'm telling you, there's a damn wolf this time and you can drive it. In fact, it could drive you. It's a self-driving wolf”. Analysts have a problem with Tesla's valuation, which is so high that Tesla cannot be classified as a car manufacturer.. but it is easier to classify it as an AI company… or you can also compare Tesla to Bitcoin.. and Tesla has delivered a higher rate of return than Bitcoin counting from Trump's election victory – see Figure 1. Besides, Tesla is also investing in Bitcoin.. and it had a significant impact on the Q4 earnings… Vaibhav Taneja, CFO: “the net income in Q4 was impacted by a $600 million mark-to-market benefit from Bitcoin due to the adoption of a new accounting standard for digital assets”. The company's Q4 2024 results were weak, but investors value optimistic prospects more, especially when Elon himself talks about them, and they concern FSD and the humanoid Optimus … Elon Musk: "I see a path of Tesla being the most valuable company in the world by far. (...) there is a path where Tesla is worth more than the next top five companies combined. (...) And that is overwhelmingly due to autonomous vehicles and autonomous humanoid robots. (...) Optimus has the potential to be north of $10 trillion in revenue." Positives for Tesla in 2025: 1) Robotaxi service to start in Austin in June 2025, 2) Low-cost model to start production in H1 2025, 3) Energy storage deployments to grow at least 50% in 2025 - see Figure 2. But there is a whole list of risks: 1) Risk of low growth in total deliveries (previously Elon spoke of a 20-30% increase in 2025, and now only about a "return to growth" in 2025) - see Figure 3, 2) Further decline in margins (Figure 4), and lower sales prices, 3) Possible withdrawal of US subsidies for EVs (JPM estimates that this could even result in a loss of around 40% of 2024 Tesla profits), 4) and anything that could negatively affect investor sentiment as Tesla's valuation is really high.. Figure 5 shows total revenues and Figure 6 the automotive segment revenues.


3-Mar-2025. Cause It Takes Two To Tango! Immediately after Trump won the election, both Tesla and Bitcoin took off like a rocket… Tesla +91% and Bitcoin (only) +52% - see Figure 1. However, from the top, Tesla was down 41% and Bitcoin 21% - see Figure 2. Bitcoin is currently up about 10% on the news that President Trump is keeping his promise to make the U.S. the “Crypto Capital of the World.” Will Tesla follow Bitcoin? We’ll soon find out if this is the same trade… :)


16-Oct-2024. ASML Earnings Moved Markets! Yesterday, the markets were spooked by the weak results of European companies such as ASML (semiconductor equipment systems) and LVMH (luxury goods). ASML fell 16%, and LVMH 7.9% (OTC market). In the case of ASML, this is the third quarter in a row of results when the price reacts negatively (Figure 1). Since the peak in July this year, ASML is already 33% lower. In the case of the SOX index (Philadelphia Semicondutor Index), we are currently 12.9% below the peak in July this year - see Figure 2. ASML announced good results, but at the same time gave weak guidance. The market was particularly scared by the decline in “Value of Booked Systems”, which fell to EUR 2.63 billion, while Wall Street expected EUR 5.39 billion – see Figure 3. ASML beat the consensus in terms of Net Sales in Q3 2024 – see Figure 4. Figure 5 shows the division of revenues into “Net System Sales” and “Net Service and Field Option Sales”. ASML CEO, Christophe Fouquet: “While there continue to be strong developments and upside potential in AI, other market segments are taking longer to recover. It now appears that the recovery is more gradual than previously expected. This is expected to continue in 2025, which is leading to customer cautiousness. (...) We expect fourth-quarter total net sales between €8.8 billion and €9.2 billion with a gross margin between 49% and 50% (...). We expect full-year 2024 total net sales of around €28 billion. Based on the recent market dynamics as mentioned above, we expect our 2025 total net sales to grow to a range between €30 billion and €35 billion, which is the lower half of the range that we provided at our 2022 Investor Day. We expect a gross margin between 51% and 53%, which is below the range we then provided, mainly related to the delayed timing of EUV demand."


TSCM Q3 2024 Preview

17-Oct-2024. After ASLM's results, it's time for TSMC's results! ASLM has spoiled the sentiment in the technology industry, and today another large technology company will report its earnings... TSMC from Taiwan. At yesterday's closing prices in the US market, TSMC is already +80.3% year to date. TSMC also publishes monthly revenues. See Figure 1. ASML fell another 6.4% yesterday and is down 9.7% this year (YTD) - see Figure 2. Adding up TSMC's monthly revenues (already published) for Q3 2024, we get TWD 759.7 trl, or USD 23.6 billion (at today's USD/TWD exchange rate of 32.21) - see Figure 3 and 4. USD 23.6 billion means an annual change of +36.5%. According to TSMC’s guidance, Q3 revenues are expected to range from USD 22.4 billion to USD 23.2 billion (at a USD/TWD exchange rate of 32.5). The total monthly revenues at this exchange rate come to USD 23.4 billion – above the company’s guidance. TSMC’s earnings may of course affect investor sentiment towards the semiconductor and technology industries. TSMC just posted its Q3 2024 results on its website and revenues are in line with expectations.. USD 23.5 billion – see next graphic.


TSCM Q3 2024 Review

18-Oct-2024. “Insane AI demand” - TSMC earnings review. TSMC not only posted very good Q3 2024 results, but also surprised Wall Street with its higher Q4-2024 and 2025 forecasts, as well as comments on AI demand. As a result TSMC stock rose 9.8% yesterday. See Figure 1. TSMC forecasts Q4 revenue growth to $26.5 billion (7.3% above Wall Street consensus), which will mean YoY growth of 35% - see Figure 2. C.C. Wei, CEO on AI demand: “The demand is real, and I believe it's just the beginning of this demand. All right. So one of my key customers say, the demand right now is insane. You know, that's -- it's just the beginning. It's from scientific to be engineering, and will continue for many years”. TSMC's largest customers include Apple and Nvidia. On current semiconductor demand cycle: “Overall semiconductor demand, except that the AI, I think everything is stabilized and start to improve.” Figure 3 shows the year-over-year revenue change for Nvidia, TSMC, and ASML. Wendell Huang, CFO on Q3 results: “ (…) our business was supported by strong smartphone and AI related demand for our industry leading 3 nanometer and 5 nanometer technologies. Gross margin increased by 4.6% points sequentially to 57.8%, (…) operating margin increased by 5% points sequentially to 47.5% (…) 3 nanometer process technology contributed 20% of wafer revenue in the third quarter while 5 nanometer and 7 nanometer accounted for 32% and 17% respectively. Advanced technologies defined as 7nanometer and below accounted for 69% of wafer revenue.”


TSCM Q3 2024 Review II

20-Oct-2024. TSMC Earnings Review, Part 2. “In 2022, TSMC led the foundry to start 3nm FinFET (N3) technology high volume production. TSMC’s 3nm process is the industry’s most advanced semiconductor technology offering best power, performance, and area (PPA), and is a full-node advance from its 5nm generation”. In Q3 2024, sales of chips manufactured in 3nm technology already accounted for 20% of total sales. Together with 5nm and 7nm, sales (together advanced technologies) accounted for 69% of total sales. See Figure 1. Currently, TSMC is already working on 2nm technology (will be available in 2025), and A16 (available in 2H 2025). C.C. Wei, CEO: “We have many, many customers interested in the 2 nanometer. And today with their activities with TSMC, we actually see more demand than we ever dream about as compared with N3. So we have to prepare more capacity in N2 than in N3. And following by A16, again, A16 is a very, very attractive for the AI server chips. And so actually the demand is also very high and so we are working very hard to prepare both 2 nanometer and A16 capacity.” Figure 2 shows Net Revenue by platform. High Performance Computing (HPC) accounts for 51% of sales, followed by smartphones with 34%. Figure 3 shows TSMC sales by geography. North America accounts for 62% of total sales! CAPEX in 2024 will be “slightly above” $30 billion. See Figure 4. Wendell Huang, CFO: “Every year, our CapEx is spent in anticipation of the growth that will follow in the future years. And our CapEx and capacity planning is always based on the long term market demand profile. As the strong structural AI related demand continues, we continue to invest to support our customers' growth. We now expect our 2024 CapEx to be slightly higher than $30 billion. Between 70% and 80% of the capital budget will be allocated for advanced process technologies. About 10% to 20% will be spent for specialty technologies and about 10% will be spent for advanced packaging, testing, mask-making, and others. At TSMC, a higher level of capital expenditures is always correlated with higher growth opportunities in the following years. And as long as our growth outlook remains strong, we will continue to invest.”


Oracle Q4 2025 Review

15-Jun-2025. Oracle on fire ? Just +22% in two days ! Safra Ada Catz, CEO & Director during the earnings conference: “So the Oracle database is on fire. And it is only the beginning (…).” After publishing solid financial results for Q4-2025, Oracle's management surprised investors with a very positive guidance. As a result, Oracle's share price rose by 22% in two days and is already +47.55% since the Liberation Day - see Figure 1. Since December 31, 2023, the share price has risen by 104% - see Figure 2. It is no wonder that the share price has risen by 22% in two days... just look at how the management presented the company's prospects during the earnings conference call (selected fragments): “In Q4, we hit double-digit revenue growth, and it's only going up from here, even as the company gets bigger. Our remaining performance obligations now stand at $138 billion, up $8 billion from last quarter and up 41% from last year, and yet the best is still to come.” “OCI has seen exceptional demand for infrastructure services and those contracted noncancelable bookings in RPO give us confidence that OCI revenue will grow over 70% this current year.” OCI – Oracle Cloud Infrastructure RPO – Remaining Performance Obligations “(…) as a result of the strength in our cloud applications and infrastructure, including database services, we are raising our revenue guidance for fiscal year '26 to over $67 billion, up 16% for the year.” “(…) we have a clear line of sight to future revenue growth. So for fiscal year 2026, I expect that total cloud revenue will grow over 40% in constant currency, up from 24% in FY '25. I expect that cloud infrastructure revenue will grow over 70%, up from 51% in FY '25. I expect total revenue will be at least $67 billion, up 16% in constant currency and up more than $1 billion from our prior guidance.” “I am still in a position where our supply is not meeting our demand. We actually currently are still waving off customers from -- or scheduling them out into the future so that we have enough supply to meet demand. This is a situation that we have not seen in our history. And the numbers themselves are so enormous. And the reason is because our technology is different. As Larry has said on previous calls, the cloud we built runs faster and has more capabilities than our competitors and that are built for enormous amounts of data. And so we are very much the destination of choice.” “CapEx is going to go up because the demand right now seems almost insatiable. I mean I don't know how to describe it. I've never seen anything remotely like this. I mean people are calling up and asking us, please, can you find us more capacity. We'll take it wherever. It's in Malaysia, we'll take it fine. We'll take it there. We got some wherever.” “So the Oracle database is on fire. And it is only the beginning. I want to remind you what a significant and large business it is and the bulk of it is still on-premise.”


Micron Q2 2026 Review

21-Mar-2026. Micron pobił oczekiwania o 71% (przychody) i 123% (EPS) W mijającym tygodniu wyniki finansowe podał amerykański producent kości pamięci Micron Technology. Wykres obok przedstawia kwartalne przychody Micron w $, zmianę rok do roku w %, oraz podział przychodów (dolny wykres) na produkcję pamięci typu DRAM, NAND i pozostałe. Jeszcze w 2023 roku kwartalne przychody Micron wynosiły $3.7bln… obecnie spółka prognozuje, że w kolejnym kwartale (Q3 2026) przychody wyniosą $33.5bln… (+/- $750m) ! Trzech największych na świecie producentów pamięci to Micron i dwie spółki z Korei Południowej: Samsung i SK Hynix. Na akcjach tych spółek mamy niesamowitą hossę… odkąd okazało się że potrzeby AI w zakresie pamięci są „nieograniczone”. Cena akcji Micron wzrosła jedynie w 2026 roku o 48% (SK Hynix +55%; Samsung +66%). A w ciągu ostatnich 12 miesięcy Micron jest +310%, SK Hynix +379%, a Samsung +231% ! Dlaczego pamięć jest krytyczna dla AI, Sanjay Mehrotra, Micron CEO: „Memory makes AI smarter and more capable, enabling longer context windows, deeper reasoning chains, and multi-agent orchestration. As AI evolves, we expect compute architectures to become more memory intensive. This is why we strongly believe that Micron Technology, Inc. is one of the biggest beneficiaries and enablers of AI. AI has not just increased demand for memory; it has fundamentally recast memory as a defining strategic asset in the AI era.” Olbrzymi popyt na kości pamięci to nie tylko klasyczne data centeres, ale także producenci autonomicznych samochodów, robotów homoidalnych itp. Sanjay Mehrotra, Micron CEO: „The average car today has less than L2 ADAS capability, containing approximately 16GB of DRAM, while vehicles with L4 autonomy require over 300GB. As more advanced ADAS and smart cabin adoption scales, we expect robust long-term growth in automotive memory demand (…) Rapid improvements in AI are supercharging the capabilities of robots. We believe we are on the cusp of a 20-year growth vector in robotics and expect robotics to become one of the largest product categories in the technology world. Humanoid robots will be AI-enabled and will be powered by a compute platform that rivals that of a high-end L4-capable automobile, thus requiring significant memory and storage capacity.” I branża producentów pamięci nie jest w stanie zrównoważyć rynku nawet do 20230 roku … prezes SK Hynix Chey Tae-Won 16 marca br. podczas konferencji GTC 2026: „Chip supply shortages will persist through 2030 (…) The shortage stems from a wafer shortage, and securing more wafers takes at least four to five years (…) an industry-wide supply shortfall of more than 20% to continue through 2030.”Sanjay Mehrotra, Micron CEO: „We expect both DRAM and NAND industry bit demand in calendar 2026 to be constrained by supply. We continue to expect supply and demand for both DRAM and NAND to remain tight beyond calendar 2026. We expect industry DRAM bit shipments in calendar 2026 to grow in the low-twenties percentage range, slightly above our prior outlook. In DRAM, cleanroom constraints and long construction lead times, higher HBM trade ratio, higher HBM growth rates, and declining bits-per-wafer growth from node migration constrain bit supply growth. We expect industry NAND bit shipments in calendar 2026 to grow approximately 20%. In NAND, some industry suppliers redirect cleanroom space for DRAM, and overall limited cleanroom space constrains bit supply growth. We expect Micron Technology, Inc. DRAM and NAND supply to grow approximately in line with the industry in calendar 2026. (…) What we have said in the last earnings call is that some of our key customers, we are able to fulfill only 50% to two-thirds of their demand in the medium term. And yes, that still remains the case.” Micron rozbił bank podając następujące wyniki:przychody za Q2 2026: $23.86 billion vs. $8.05 billion y/y, estimate $19.74 billionprognoza przychodów na Q3 2026: $33.5 billion, estimate $23.66 billionŁącznie Micron pobił oczekiwania Wall Street odnośnie przychodów o $13.96 bilion, czyli 70.7% ! W przypadku EPS:Q2 2026 Adjusted EPS $12.20 vs. $1.56 y/y, estimate $9.00prognoza Q3 2026 adjusted EPS $18.75 to $19.55 (mid $19.15), estimate $11.29Łącznie Micron pobił oczekiwania Wall Street odnośnie EPS o $11.06, czyli o 123% Marża brutto (adjusted, non-GAAP) wyniosła w Q2 74.9% vs. 37.9% y/y, estimate 69.1%a prognoza spółki na Q3 to 81%, estimate 72.4% ! Sanjay Mehrotra, CEO, na temat niesamowitych wyników za Q2 2026: „Micron set new records across revenue, gross margin, EPS, and free cash flow in fiscal Q2, driven by a strong demand environment, tight industry supply, and our strong execution, and we expect significant records again in fiscal Q3.”Sanjay Mehrotra, CEO, na temat niesamowitej prognozy spółki na kolejny kwartał (Q3 2026): „Our fiscal Q3 single-quarter revenue guidance exceeds the full-year revenue for every year in our company's history through fiscal 2024. For fiscal Q3, we anticipate exceptional growth across revenue, gross margin, EPS, and free cash flow.” Sanjay Mehrotra na temat wydatków kapitałowych: „We expect fiscal 2026 CapEx to be above $25bln. From our last earnings call estimate, the majority of the increase is driven by cleanroom facility-related CapEx (…). We project our fiscal 2027 CapEx to step up meaningfully to support HBM and DRAM-related investments. We expect construction-related CapEx to increase by over $10bln year over year in fiscal 2027 as we build out our global manufacturing sites to address long-term demand opportunities.” Micron podpisał w mijającym kwartale pierwszą nową umowę długoterminową… 5-letnią umowę SCA z jednym z swoich największych klientów (Strategic Customer Agreement.. long-term, multiyear supply arrangements with specific volume and pricing commitments to improve business predictability for both Micron Technology and its customers). Taka umowa ma na celu „wygładzenie” cyklu spółki, który historycznie był bardzo „brutalny”… np. przychody w 2023 roku spadły rok do roku o ponad 56% (patrz wykres na poprzednim slajdzie). Na telekonferencji wynikowej padło bardzo wiele pytań odnośnie tej umowy… potencjalnie takie umowy mogą prowadzić do wyższej wyceny Micron np. na wskaźnikach PE (obecnie Micron jest wyceniany na wskaźniku forward PE jedynie 6x… a np. Alphabet 25x; Nvidia 22x; Apple 29x; ASML 39x)Sanjay Mehrotra: „These agreements are really meant to bring stability and greater visibility into our business model as well. (…) SCAs are meant to achieve the objectives for the customers in terms of their ability to plan and be able to count on supply commitments that are in the agreements, but also for us to be able to count on specific commitments that are there from the customers. These are meant to go across periods when the industry is very tight versus other parts of the industry environment as well. That is why they are long-term agreements, and they have robust terms in them.” Powyższy wykres pokazuje zmianę ceny Micron (od 1 stycznia 2024… +395%) na tle zmiany zysków spółki EPS… które w przypadku zysków prognozowanych za kolejne 12 miesięcy (forward EPS) wzrosły od 1 stycznia 2024 o +377%, a w przypadku zysków opublikowanych za ostatnie 12 miesięcy (trailing EPS) wzrosły od 1 stycznia 2025 o +560%. W przypadku trailing EPS podaje wzrost od 1 stycznia 2025 (a nie 1 stycznia 2024) ponieważ przed 1 stycznia 2025 trailing EPS był ujemny… (spółka raportowała straty). Dla pełnego obrazu forward EPS od 1 stycznia 2025 wzrósł do dzisiaj o +428%... Innymi słowy zyski Micron (licząc od 1 stycznia 2025) rosną szybciej niż kurs akcji… zyski wzrosły o 428% i 559% … podczas gdy kurs o 403% ! Innymi słowy pomimo wzrostu kursu o 400% spółka zrobiła się nawet tańsza… Forward PE dla Micron wynosi obecnie jedynie 6.4x; dla Samsunga 7.8x; a dla SK Hynix 5.6xProducenci kości pamięci są wyceniani na bardzo niskich wskaźnikach PE (w porównaniu do innych spółek technologicznych, ale też szerokiego rynku.. np.. forward PE dla S&P500 wynosi obecnie około 20.3x)


Micron forward PE tylko 4.1!


28-Mar-2026. Micron Forward PE to tylko 4.10 ! Wraz ze spadającymi cenami akcji spadają też wskaźniki wyceny, szczególnie że zyski spółek ciągle całkiem mocno rosną. Wskaźnik Forward PE dobrze oddaje wycenę spółek, gdyż jednocześnie bierze pod uwagę zmianę oczekiwanych przez Wall Street zysków w kolejnych 12 miesiącach i bieżącą zmianę ceny akcji. Wykres obok przedstawia Forward PE dla największych globalnych spółek technologicznych/AI Dwie spółki od 2023 roku są „poza wykresem”, gdyż ich wskaźniki są sporo powyżej 100x (o ile tak wysokie wskaźniki nie są niemożliwe dla małych spółek… to w przypadku tak dużych spółek jak Tesla (market cap $1.37 trl), oraz Palantir (market cap $344 bln) jest to rzadko spotykane. Obecny Forward PE dla Tesli to 189x, a dla Palantir „jedynie” 108.6x ! Ale jeszcze pod koniec zeszłego roku obie spółki miały Forward PE powyżej 200x ! Poza Teslą i Palantir – jedynie jedna spółka ma obecnie PE powyżej 30x.. ASML z forward PE 38.2x (patrz szczegóły w tabeli pod wykresem). Trzecia kolumna w tabeli pod wykresem pokazuje percentyl na którym obecnie jest wskaźnik PE dla danej spółki… i tak w przypadku Nvidia forward PE na poziomie 20.3x to jedynie 12.6 percentyl rozkładu z lat 2020-2026. W zasadzie jest to druga najniższa wycena w porównaniu do własnej historii ze wszystkich spółek… niższy percentyl (9.9%) ma Micron Technology z wskaźnikiem jedynie na poziomie 4.1x. Micron to nie jest mała spółka… obecna kapitalizacja rynkowa to $411 mld (innymi słowy rynek oczekuje ponad $100 mld zysków w kolejnych 12 miesiącach !). Tak niskie wskaźniki wyceny z reguły możliwe są jedynie w przypadku bardzo cyklicznych (innymi słowy bardzo ryzykownych) spółek, do których należą/należały spółki produkujące kości pamięci (Micron, Samsung, SK Hynix – te spółki mają jednocyfrowe wskaźniki Forward PE) Ale w obecnym „super cyklu AI” może być trochę inaczej…Morgan Stanley (19 marca br.) na temat zysków Micron: „So we don't think 81% gross margin is the new normal, but it's also hard to see that getting worse in the next several quarters. (…) Our view is that looking for sell signals from prior cycles misses the point - this is not only likely to be durable as long as AI spending is maxed out, at this point based on our industry conversations we think that memory is one of the biggest gating factors on how much AI spending is possible.” Od początku roku największy spadek forward PE dotyczytakich spółek jak Microsoft (-7.7 punktów), Broadcom (-7.5 punktów) oraz Oracle (-7.2 punktów). Na 4 miejscu mamy Nvidia z spadkiem PE o 4.0 punkty (patrz tabela obok) Ciekawym przypadkiem jest Palantir, którego forward PE spadł z poziomu 235x (31-Oct-2025) do 108.6x obecnie.Od 31-Oct-2025 Forward EPS wzrósł o 55%, a cena akcji spadła w tym samym okresie o 29% ! Stąd spadek Forward PE z 235x do 108.6x !

Broadcom Q1 2026 Review

7-Mar-2026. Broadcom over $100 billion in AI chip revenue by 2027 sic! Broadcom to 6 największa spółka w S&P500 i główny globalny producent specjalistycznuych chipów AI tzw. ASIC. Broadcom podał bardzo dobre wyniki za Q1 2026 (publikacja wyników miała miejsce 4 marca 2026 za kwartał kończący się 1 lutego 2026). Kurs spółki wzrósł w dwa dni o +4.1% .. co jest niezłym wynikiem na tle ogólnego rynku (S&P500 spadł w tym samym czasie o -1.9%). Przychody całkowite wyniosły $19.3bln (powyżej guidance spółki na poziomie $19.2bln), natomiast EPS wyniósł (Non-GAAP diluted EPS) $2.05 (rynek oczekiwał $2.03). Guidance na kolejny kwartał był bardzo mocny: „Second quarter fiscal year 2026 revenue guidance of approximately $22.0 billion, an increase of 47 percent from the prior year period”. $22.0bln w kolejnym kwartale to zdecydowanie powyżej oczekiwań na poziomie $20.5bln ! Poniższa (pierwsza) tabela przedstawia zmianę oczekiwań Wall Street odnośnie przychodów w kolejnych 8 kwartałach… przyszłe przychody za kolejne 12 miesięcy podskoczyły po wynikach o 6.5% ! W przypadku EPS mówimy o wzroście oczekiwań Wall Street aż o 10.6% ! Poniższa (druga) tabela pokazuje „efekt” ogłoszenia wyników przez Broadcom na zmianę oczekiwań Wall Street. Istotnym elementem wyników Broadcom są tzw. AI Revenues, będące częścią oficjalnego segmentu działalności „Semiconductor Solutions”. W Q1 2026 AI Revenues wyniosły $8.4bln (wzrost o +104.9% rok do roku), natomiast guidance spółki na kolejny kwartał wyniósł aż $10.7bln (co będzie oznaczać wzrost aż o +143% rok do roku – patrz dolny wykres po prawej). Poniższa (trzecia) tabela przedstawia zmianę oczekiwań Wall Street (przed i po ogłoszeniu wyników przez Broadcom). Hock Tan, CEO: „Let me now give you more color on our semiconductor business. In Q1, revenue was a record $12.5 billion as year on year growth accelerated to 52%. This robust growth was driven by AI semiconductor revenue, which grew 106% year on year to $8.4 billion, way above our outlook. In Q2, this momentum accelerates and we expect semiconductor revenue to be $14.8 billion, up 76% year on year. Driving this is AI revenue growth, which will accelerate very sharply to 140% year on year to $10.7 billion.” „our visibility in 2027 has dramatically improved. Today, in fact, we have line of sight to achieve AI revenue from chips, just chips, in excess of $100 billion in 2027 (…) when I say we forecast, we have a line of sight that our revenue in 2027 will be significantly in excess of $100 billion, I am focusing on the fact that these are pretty much all based on chips, whether they are XPUs, whether they are switch chips, DSPs—these are silicon content we are talking about Broadcom ma teraz 6 dużych klientów w biznesie XPU, Hock Tan, CEO: „For Google, we continue our trajectory of growth in 2026 with strong demand for the seventh generation iNode TPU. In 2027 and beyond, we expect to see even stronger demand from next generations of TPU. For Anthropic, we are off to a very good start in 2026 for 1 gigawatt of TPU compute. And for 2027, this demand is expected to surge in excess of 3 gigawatts of compute. Our XPU franchise, I should add, extends beyond TPUs. Now contrary to recent analyst reports, Meta's custom accelerator MTIA roadmap is alive and well. We are shipping now. And in fact, for the next generation XPUs, we will scale to multiple gigawatts in 2027 and beyond. Rounding off for customers four and five, we see strong shipments this year which we expect to more than double in 2027. We also now have a sixth customer. We expect OpenAI to be deploying in volume their first generation XPU in 2027 at over 1 gigawatt of compute capacity.” „this generative AI race that we are in now—and I should not use the word race; let us call it progression—among the few players we see here. I mean, it is a competition. Each is trying to create an LLM better than the other and more tailored for specific purpose, be they enterprise, be they consumer, be they search. Each one is trying to create it more and more. And all of that requires not just training, which is important to keep improving your LLM models, but inference for productization and monetization of your LLM. And we are getting better and better visibility as they have more and more confidence that the XPUs they are working on with us are achieving what they are getting at (…) They do not think one generation at a time. They think multiple generations, multiple years. And in spite of all the few-breeze noise out there on what is available, they think very long term on how they deploy the experience they develop with us, how they deploy in achieving better and better LLMs that they want to create, and more than that, how to deploy in monetizing. So we are part of their strategic roadmap. "We are not in just optionality of, oh, shall I use a GPU, shall I use it in the cloud because I need to train for six months. No. This is more than that. The investments these guys are making are long term (…) And to sum it all, I think our business in XPUs is a strategic sustainable play for all the six customers we have today.”